For Apr, 03 2014
(Individual Chart Analysis)
This is a no-frills analysis. It is not designed
to look good, it is designed to be effective.
Summary of the Technical Analysis for the DOW
(This takes into account the near term, mid term, and longer term charts)
Our combined analysis for Thursday tells us to expect the market to begin the day with a bias to increase and it tells us to treat initial resistance as inflection, but the market has already broken above midterm resistance and the door is open for continued market increases. Initial resistance as that is defined in our combined data tables is near term resistance, and that is not as strong as the recently broken midterm resistance lines that now act has converted support. However, initial resistance must be crossed for the market to move higher, so according to our combined analysis for Thursday initial resistance acts as an upside confirmation catalyst, and if it breaks higher we should expect more aggressive upside market moves to follow. Otherwise, expect the market to pull back to recently broken midterm resistance levels, the converted support lines, and a more neutral environment instead. Our current combined analysis is positive, and points to longer term resistance in the S&P 500 if the breaks of midterm resistance continue to hold.
| Initial intraday trading parameters for the DOW exist between16482 - 16650 |
| If 16482 breaks lower expect 16400 |
| If16650breaks higher expect 17000 |
| Otherwise expect16482 - 16650 to hold |
If 16482 remains in tact as initial support, expect the market to increase to 16650. This reflects a tight near term down channel. However, and in line with our combined analysis, if 16482 breaks lower instead expect the market to decline to 16400 before it stabilizes again.
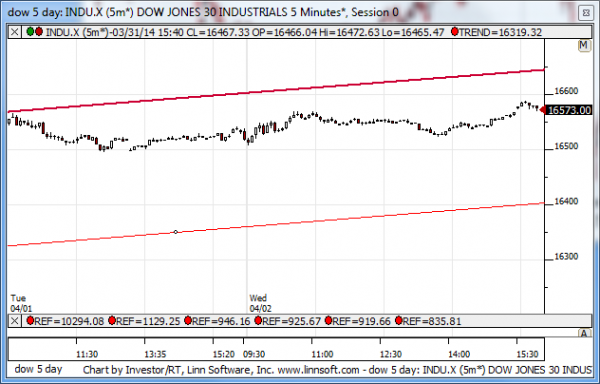
NEAR Term Analysis
Our combined near-term analysis tells us that the market is mostly in a near-term upward sloping channel and it is approaching resistance. According to our combined near-term analysis the market should begin the day with a bias to increase as it opens on Thursday and a test of near-term resistance should follow. If resistance holds expect a decline to a higher low, but if resistance lines in the near term chart patterns break higher instead we should be prepared for accelerated and momentum market increases.
NEAR Term Support for the DOW exists at 16400
NEAR Term Resistance for the DOW exists at 16650
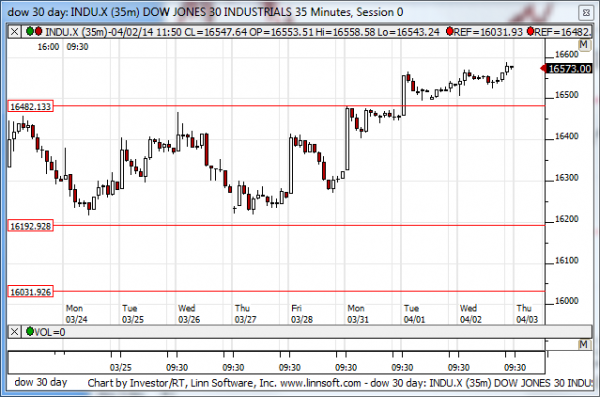
MID Term Analysis
Our combined midterm analysis tells us that the market is over midterm resistance levels and so long as that remains true the market is capable of accelerating. Our combined midterm analysis is therefore bullish, conditionally, assuming that recently broken resistance levels remain intact as converted support. If that is true, our combined midterm analysis tells us to expect aggressively higher market levels, but if the market falls back below converted support lines it is likely to fall back to recent lows instead. That makes converted support inflection for our swing trading strategies.
MID Term Support for the DOW exists at 16192
MID Term Resistance for the DOW exists at 16482
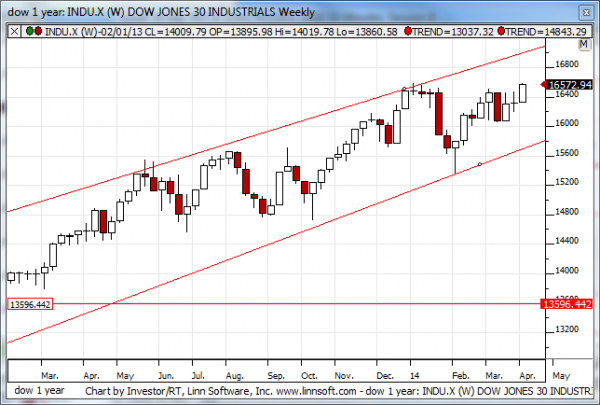
LONG Term Analysis
Our combined longer term analysis tells us that the NASDAQ and Russell fell from tests of longer term resistance to longer term support very quickly, and they are now testing loner term support. The S&P and Dow have not only not tested resistance, but they also did not fall as hard as the NASDAQ or Russell 2000, and they are not testing longer term support. However, there is a Doji in the longer term pattern of the Dow, like there was in the NASDAQ before it fell hard, and if that Doji in the Dow is confirmed it could quickly catch up with the other markets and threaten its respective longer term support line as well. According to our combined analysis risks are serious, the NASDAQ and the Russell have been leaders on the up and downside, but in order for the markets to realize the severity of the risks that our longer term analysis currently illustrates, the Dow and S&P must also begin to weaken.
LONG Term Support for the DOW exists at 15800
LONG Term Resistance for the DOW exists at 17000