For Apr, 10 2014
(Individual Chart Analysis)
This is a no-frills analysis. It is not designed
to look good, it is designed to be effective.
Summary of the Technical Analysis for the S&P 500
(This takes into account the near term, mid term, and longer term charts)
Our combined analysis for Thursday tells us to expect the market to begin the day with a bias to increase and because midterm support levels were tested and near term intra channel resistance levels broke higher earlier in the week, a progression towards midterm resistance levels is likely. For the NASDAQ and the Russell 2000 this means a lower high, because those midterm channels are downward sloping, but higher levels are likely nonetheless. Additionally, and something that would support a break above midterm resistance in those markets as well, our combined longer-term analysis for the NASDAQ and the Russell 2000 tell us that those markets reversed back into their longer term channels, in essence they held longer term support after a temporary break early in the week, and if that remains true our combined longer-term analysis for those markets will actually be quite bullish, suggesting much higher levels than what midterm resistance levels portray. Our combined analysis is therefore positive immediately given the progression towards midterm resistance that is expected within the midterm channels, but it could turn even more positive if the market confirms that longer term support levels were tested and they held in the NASDAQ and the Russell 2000 at the end of the week.
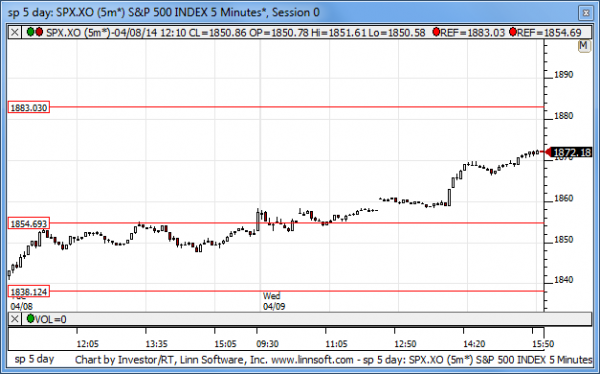
| Initial intraday trading parameters for the S&P 500 exist between1854 - 1883 |
| If 1854 breaks lower expect 1839 |
| If1883breaks higher expect 1894 |
| Otherwise expect1854 - 1883 to hold |
If 1854 remains in tact as initial support, expect the market to increase to 1883. This reflects a tight near term down channel. However, and in line with our combined analysis, if 1854 breaks lower instead expect the market to decline to 1839 before it stabilizes again.
NEAR Term Analysis
Our combined near-term analysis tells us that the market has broken above near term intra channel resistance and it appears to be in the process of increasing towards near-term neutral resistance, the highest level of resistance in the near term chart patterns, at this time. According to our combined near-term analysis we should expect the market to begin the day with a bias to increase as it opens on Thursday and higher levels are likely so long as the market remains above the recently broken intra channel resistance lines that have now been converted into support. Target resistance if that happens, but understand that the near-term patterns are neutral at the same time.
NEAR Term Support for the S&P 500 exists at 1838
NEAR Term Resistance for the S&P 500 exists at 1854
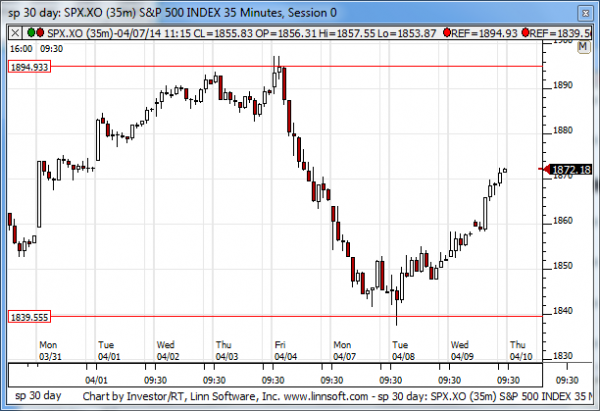
MID Term Analysis
Our combined midterm analysis tells us the market is progressing from recent tests of midterm support towards midterm resistance again, but higher levels are still probable because resistance levels have not been tested yet. According to our combined analysis the market is likely to progress higher until such time as midterm resistance levels are tested, and from there the market is likely to come under pressure again. If resistance remains intact a complete oscillation back down to support is likely, but if the resistance lines that stand in place now break higher instead the markets are likely to develop new midterm channels, at least the NASDAQ and the Russell 2000 are.
MID Term Support for the S&P 500 exists at 1839
MID Term Resistance for the S&P 500 exists at 1894
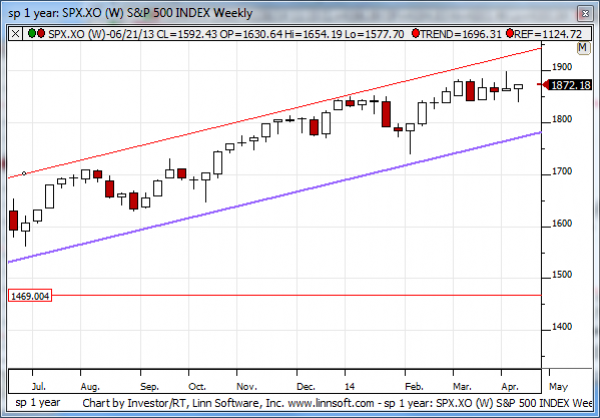
LONG Term Analysis
Our combined longer-term analysis tells us that the NASDAQ and the Russell 2000 have reversed from a temporary break below longer term support lines and they're trying to retrace back into their longer-term upward sloping channels. If this happens successfully our combined analysis will point to much higher levels in these markets, suggesting a move from support to resistance specifically. That would make a successful test of support a buy signal in the NASDAQ and the Russell 2000 if longer term support manages to hold after the risk of breakdowns that existed recently, but this will not be confirmed until the weekly candles that exist for this week are completed on Friday.
LONG Term Support for the S&P 500 exists at 1775
LONG Term Resistance for the S&P 500 exists at 1940