For Apr, 17 2014
(Individual Chart Analysis)
This is a no-frills analysis. It is not designed
to look good, it is designed to be effective.
Summary of the Technical Analysis for the S&P 500
(This takes into account the near term, mid term, and longer term charts)
Our combined analysis for Thursday tells us to expect the market to begin the day with a bias to increase and it tells us that the market can also experience another momentum driven increase because no near-term resistance levels exist and the midterm downward sloping resistance lines have broken higher almost across the board. This puts midterm neutral resistance in play as our upside target, which will hold if the market remains above recently broken resistance levels. Initial support in our combined data tables represents former levels of resistance that have now been converted into support, and if those remain intact our combined analysis tells us to expect higher levels. However, if the markets reverse back down under these formal resistance lines, the gains witnessed on Wednesday could easily be reversed.
| Initial intraday trading parameters for the S&P 500 exist between1843 - 1883 |
| If 1843 breaks lower expect 1814 |
| If1883breaks higher expect 1940 |
| Otherwise expect1843 - 1883 to hold |
If 1843 remains in tact as initial support, expect the market to increase to 1883. This reflects a tight near term down channel. However, and in line with our combined analysis, if 1843 breaks lower instead expect the market to decline to 1814 before it stabilizes again.
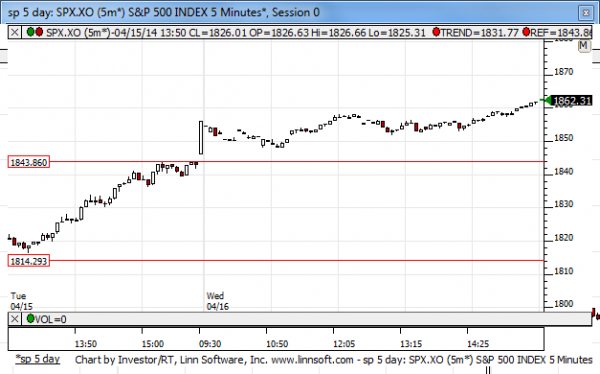
NEAR Term Analysis
Our combined near-term analysis tells us that we should expect the market to begin the day with a bias to increase as it opens on Thursday and if recently broken near term neutral resistance lines remain intact as converted support, a conversion that happened when resistance broke higher on Wednesday, we should also expect accelerated market increases. Converted support is former resistance, and it acts as inflection. If it breaks lower instead the market is likely to change its near-term patterns, but if it holds the market is likely to increase because at least for now near term resistance does not exist above current market levels in the near term charts.
NEAR Term Support for the S&P 500 exists at 1814
NEAR Term Resistance for the S&P 500 exists at 1843
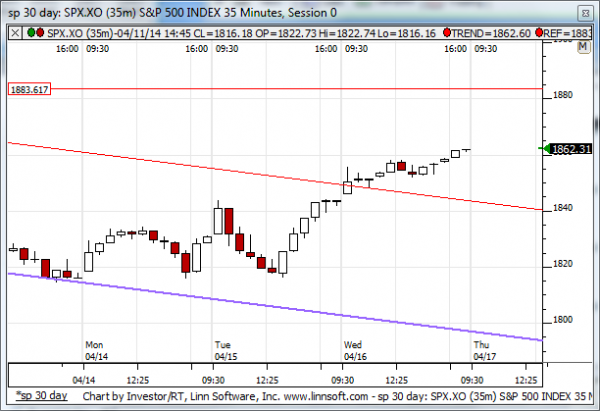
MID Term Analysis
Our combined midterm analysis tells us that the markets are beginning to break above midterm downward sloping support lines. The Dow Jones industrial average, S&P 500, and Russell 2000 all have already done this, and only the NASDAQ has not yet. The NASDAQ is resting on midterm down channel resistance though, and if it breaks higher all markets will have broken above their midterm downward sloping resistance lines signaling a move higher from their until such time as midterm neutral resistance lines are tested.
MID Term Support for the S&P 500 exists at 1797
MID Term Resistance for the S&P 500 exists at 1840
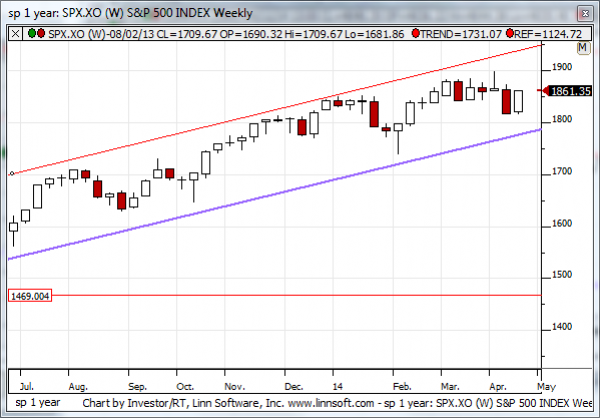
LONG Term Analysis
Our combined longer-term analysis tells us that breaks of longer term support in the NASDAQ and the Russell 2000 were confirmed on Friday and this creates a red flag pointing to substantially lower market levels. According to our combined longer-term analysis the market could fall all the way down to where it was at the beginning of 2013, wiping out all of the gains from last year and putting the market back below its 2007 peak.
LONG Term Support for the S&P 500 exists at 1775
LONG Term Resistance for the S&P 500 exists at 1940