For Aug, 01 2014
(Individual Chart Analysis)
This is a no-frills analysis. It is not designed
to look good, it is designed to be effective.
Summary of the Technical Analysis for the DOW
(This takes into account the near term, mid term, and longer term charts)
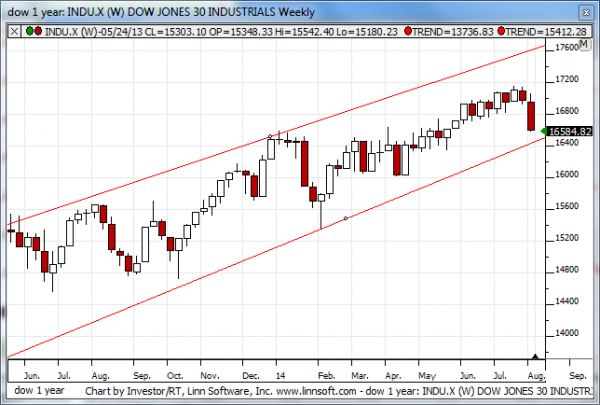
Our combined analysis for Friday tells us that support levels are few and major resistance levels have already broken, and even slight declines from current levels could be followed by momentum driven declines again. Tests of longer term support in the Dow look very likely soon, and given the bearish candles in the longer term charts as of Thursday's close, if Friday is not an aggressive up day the read will be very bearish for next week and possibly for much longer than that. The read is already very concerning, red flags are everywhere, and the longer term charts warn us that the Dow is on a path to longer term support and it could break support like the Russell and the NASDAQ already have, and if the Dow breaks longer term support that would break the up-channel that began in early 2013 and open the door for major market declines that would make Thursday's pullback look like child's play.
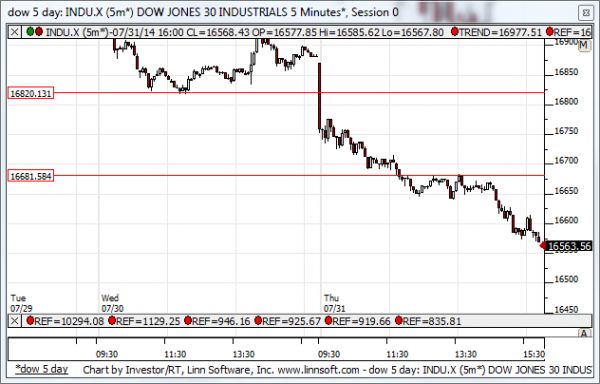
| Initial intraday trading parameters for the DOW exist between16460 - 16681 |
| If 16460 breaks lower expect 16000 |
| If16681breaks higher expect 16828 |
| Otherwise expect16460 - 16681 to hold |
If 16460 remains in tact as initial support, expect the market to increase to 16681. This reflects a tight near term down channel. However, and in line with our combined analysis, if 16460 breaks lower instead expect the market to decline to 16000 before it stabilizes again.
NEAR Term Analysis
Our combined near term analysis tells us to expect the Market to begin the day looking for direction, but because major support levels have broken any additional selling could result in momentum driven decline. Be prepared for a cautious opening session but also prepare for momentum driven declines if the Market trickles lower even slightly from its closing level.
NEAR Term Support for the DOW exists at
NEAR Term Resistance for the DOW exists at 16681
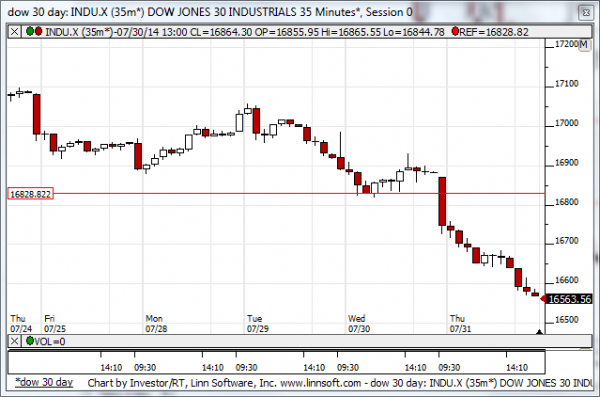
MID Term Analysis
Our combined midterm analysis tells us that the S&P and Dow have shattered their midterm up-channels and downward sloping channels are waiting to form, but the declines Thursday were so violent that there is no sustainable trend yet. This means that unless the market bounces fast we should expect additional violent declines, but if it bounces we should expect a lower low and a down channel to form afterwards.
MID Term Support for the DOW exists at
MID Term Resistance for the DOW exists at 16828
LONG Term Analysis
Our combined longer term analysis tells us that bearish candles are forming in all markets and suddenly the Dow Jones Industrial average looks like it could threaten longer term support. If the Dow breaks below longer term support it will be a massive red flag. Risks are already sky high though because our longer term charts from the other markets point to lower levels and if that happens breaks could happen in the Dow's longer term chart and the up-trend that began in 2013 would not only have fallen apart for the Russell and the NASDAQ, which is already has, but for the Dow as well.
LONG Term Support for the DOW exists at 16460
LONG Term Resistance for the DOW exists at 17640