For Dec, 01 2014
(Individual Chart Analysis)
This is a no-frills analysis. It is not designed
to look good, it is designed to be effective.
Summary of the Technical Analysis for the DOW
(This takes into account the near term, mid term, and longer term charts)
Our combined analysis for Monday tells us to respect support as inflection. If the Markets hold support they will likely make higher highs in line with the midterm patterns, but if support breaks lower the Markets could begin a more meaningful pullback. The midterm channels in the S&P and DJIA seem to say it all. The slopes of those channels are upward sloping, but they are also resting right on support. If support holds the natural target will be upward sloping resistance, but if support breaks the next level of support is far lower, and that would signal aggressive declines. That makes initial support as we offer that in our combined data tables inflection, but there is also an added catalyst. If the market satisfies a decline to neutral support levels it will probably also cause the longer term charts to turn bearish. Please read the observations int he longer term charts carefully. Right now breaks have not happened, and we should not expect breaks to happen until they do by rule, but there are clear warnings and they could be significant. If support breaks, our combined analysis tells us to respect it, but support has not yet broken. Monitor it closely though.
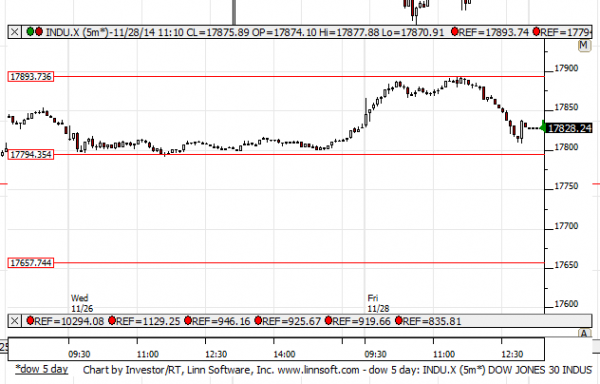
| Initial intraday trading parameters for the DOW exist between17785 - 17893 |
| If 17785 breaks lower expect 17657 |
| If17893breaks higher expect 17995 |
| Otherwise expect17785 - 17893 to hold |
If 17785 remains in tact as initial support, expect the market to increase to 17893. This reflects a tight near term down channel. However, and in line with our combined analysis, if 17785 breaks lower instead expect the market to decline to 17657 before it stabilizes again.
NEAR Term Analysis
Our combined near term analysis tells us that the Market is in a near term neutral channel and it suggests that not only has the highest neutral resistance lines been tested but so has the intra channel support lines. Intra channel support is actually inflection though, because the current channel tells us to expect a progression to the lowest neutral support line, but that can only happen if the intra channel level of support breaks first. If it breaks expect the lowest levels of neutral support in the near term charts, but if it holds expect another test of the highest resistance lines instead.
NEAR Term Support for the DOW exists at 17794
NEAR Term Resistance for the DOW exists at 17893
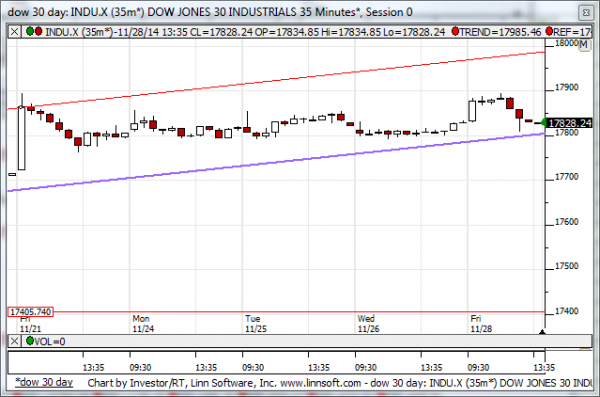
MID Term Analysis
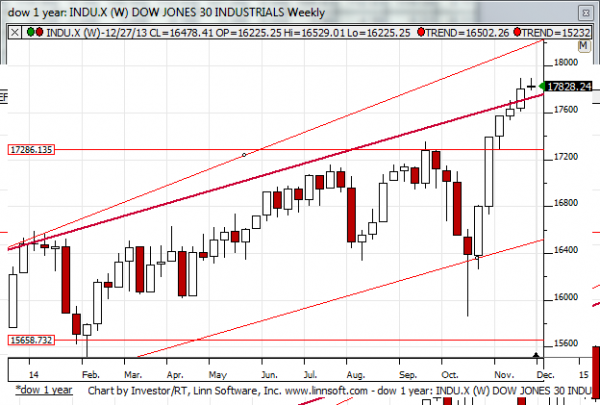
Our combined midterm analysis tells us to focus on the S&P 500 and the Dow Jones Industrial Average. These markets are in midterm up-channels, but they are also testing support. The next level of support under up-channel support in these markets is much lower, however, so the importance of the upward sloping support lines in these markets is magnified. If support holds (it has not broken yet) the current upward sloping trend line that exists now will hold and we should expect higher highs in accordance with that trend line. However, if the trend line breaks, if support breaks, be prepared for aggressive declines because the next level of support is significantly lower (17400 in the DJIA).
MID Term Support for the DOW exists at 17800
MID Term Resistance for the DOW exists at 17995
LONG Term Analysis
Our combined longer term analysis tells us that the Market are all very close to longer term resistance, and although there is still a generally positive bias, all it would take is a modest reversal in the markets to cause what is not a positive longer term take to shift to a bearish one. The DJIA, for example, would need to dip back under it longer term trend line, the one that broke higher recently and has since been converted into resistance. If the DJIA does this the longer term patterns can become bearish, but otherwise the positive tone will continue.
LONG Term Support for the DOW exists at 17770
LONG Term Resistance for the DOW exists at 18205