For Jul, 24 2014
(Individual Chart Analysis)
This is a no-frills analysis. It is not designed
to look good, it is designed to be effective.
Summary of the Technical Analysis for the DOW
(This takes into account the near term, mid term, and longer term charts)
Our combined analysis for Thursday tells us to expect the Market to begin the day looking for direction and it tells us to expect a tight neutral channel unless either initial support or initial resistance as that is defined in our combined data tables breaks lower or higher respectively. If a break happens expect momentum moves in the direction of the break, but unless a break happens expect a slow sideways environment. Our combined analysis for Thursday tells us that this could be the slowest day in recent memory if the Market fails to break below initial support or above initial resistance as that is offered in our combined data tables.
| Initial intraday trading parameters for the DOW exist between17065 - 17150 |
| If 17065 breaks lower expect 16974 |
| If17150breaks higher expect 17600 |
| Otherwise expect17065 - 17150 to hold |
If 17065 remains in tact as initial support, expect the market to increase to 17150. This reflects a tight near term down channel. However, and in line with our combined analysis, if 17065 breaks lower instead expect the market to decline to 16974 before it stabilizes again.
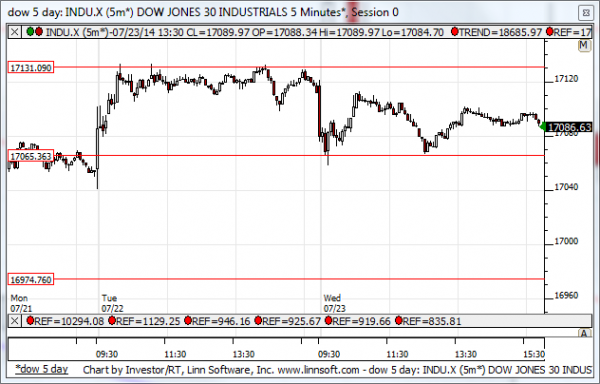
NEAR Term Analysis
Our combined near term analysis tells us that the Market is in a near term neutral channel and it is in a tight upper tier as well. We should expect this tight range to hold unless it breaks, so respect both support and resistance equally. If resistance breaks higher be ready for a surge, if support breaks lower expect a breakdown, but if neither break expect the neutral channel to hold.
NEAR Term Support for the DOW exists at 17065
NEAR Term Resistance for the DOW exists at 17131
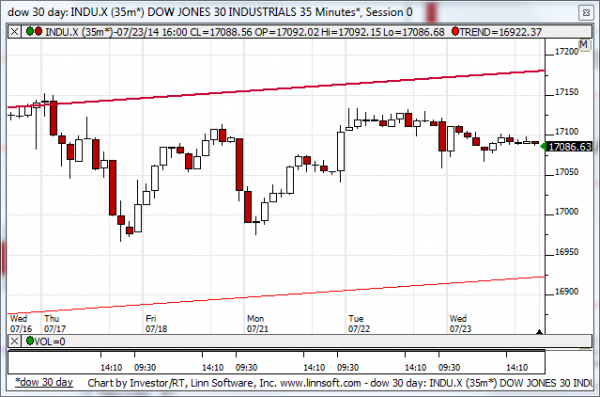
MID Term Analysis
Our combined midterm analysis shows us that the S&P is breaking midterm resistance and that is a potentially bullish sign. No other markets are doing this though, so the S&P is a lone wolf at this time. Other markets will need to join the S&P and offer bullish reads for this to catch fire, but the S&P is certainly leading the way.
MID Term Support for the DOW exists at 16925
MID Term Resistance for the DOW exists at 17180
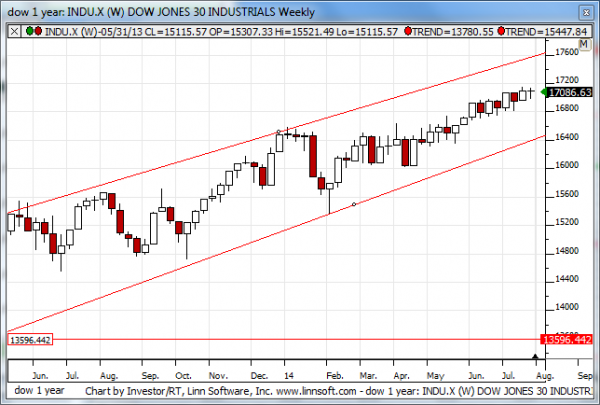
LONG Term Analysis
Our combined longer-term analysis still tells us that the Russell 2000 is bearish and the NASDAQ has fallen back, but those warnings don't exist for the S&P 500 or Dow Jones industrial average, and recent patterns suggest that the S&P 500 and Dow Jones industrial average could accelerate higher and test their longer-term resistance levels. If that happens we should expect a test of 2030 in the S&P 517,600 in the Dow Jones industrial average.
LONG Term Support for the DOW exists at 16400
LONG Term Resistance for the DOW exists at 17600