For Jul, 25 2014
(Individual Chart Analysis)
This is a no-frills analysis. It is not designed
to look good, it is designed to be effective.
Summary of the Technical Analysis for the DOW
(This takes into account the near term, mid term, and longer term charts)
Our combined analysis for Friday tells us to respect 1985 in the S&P 500 again. This time, the S&P 500 is slightly above that level, and although the market had the potential to break out when it broke above 1985 recently, it did not. This is not and immediately concerning factor, but if the market breaks back below 1985 again it will create big red flags and potentially bearish environments. A reversal from the S&P 500 should be respected as inflection for Friday and the days that follow. If the S&P 500 fails to hold recently broken resistance, which has now been converted into support, what is a rather sanguine environment can turn and a bearish one can follow. The Russell 2000 is already bearish on a longer term basis and the NASDAQ is capable of turning bearish at any time.
| Initial intraday trading parameters for the DOW exist between17065 - 17150 |
| If 17065 breaks lower expect 16950 |
| If17150breaks higher expect 17600 |
| Otherwise expect17065 - 17150 to hold |
If 17065 remains in tact as initial support, expect the market to increase to 17150. This reflects a tight near term down channel. However, and in line with our combined analysis, if 17065 breaks lower instead expect the market to decline to 16950 before it stabilizes again.
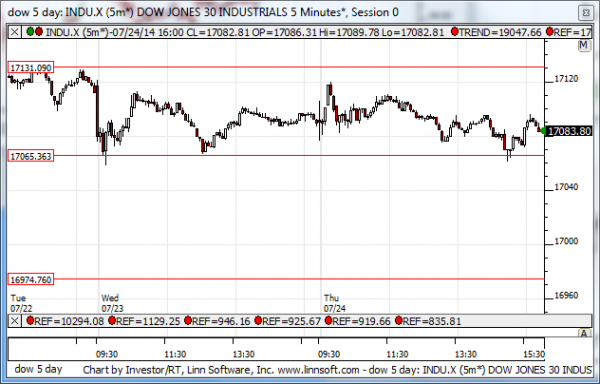
NEAR Term Analysis
Our combined near-term analysis tells us that the market is in a tight near term channel but below this tight channel is a gap that is extremely wide. We should expect the market to trade in a sideways fashion unless it breaks above resistance or below support, but beware of any breaks below support because they can be followed by aggressive and momentum driven declines according to our combined near-term analysis. That makes support much more important than resistance in this tight near term channel, so please respect it.
NEAR Term Support for the DOW exists at 17065
NEAR Term Resistance for the DOW exists at 17131
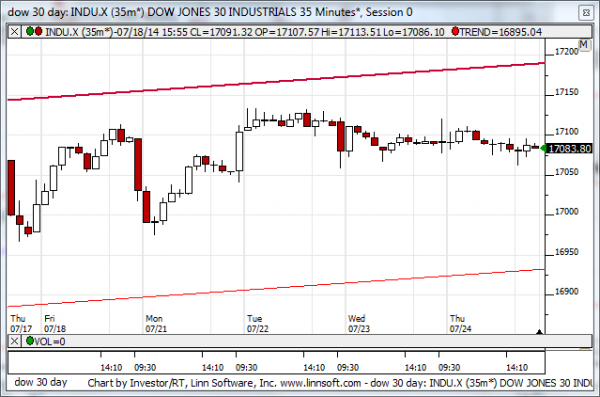
MID Term Analysis
Our combined midterm analysis tells us that the NASDAQ tested midterm neutral resistance, but the S&P 500 is still above 1985 and so long as that is true the markets will have a positive bias, but the moment the S&P 500 reverses below 1985 again all of that can change. If the S&P 500 breaks below 1985 it will break back into its channel an open the door for momentum driven declines back towards midterm support levels again. Given the test of resistance that happened in the NASDAQ a decline like that would be supported, but it rests on the S&P 500's ability or inability to hold above 1985.
MID Term Support for the DOW exists at 16930
MID Term Resistance for the DOW exists at 17185
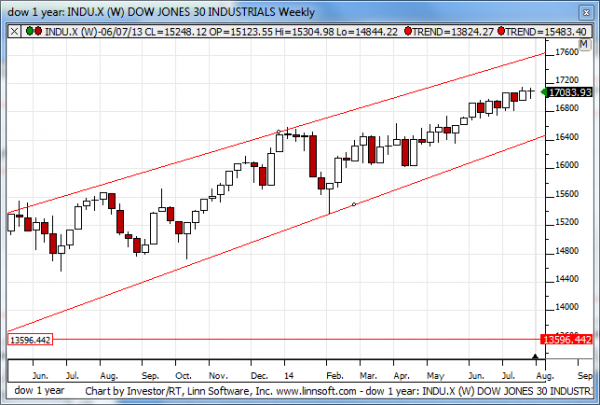
LONG Term Analysis
Our combined longer-term analysis still tells us that the Russell 2000 is bearish and the NASDAQ has fallen back, but those warnings don't exist for the S&P 500 or Dow Jones industrial average, and recent patterns suggest that the S&P 500 and Dow Jones industrial average could accelerate higher and test their longer-term resistance levels. If that happens we should expect a test of 2030 in the S&P 517,600 in the Dow Jones industrial average.
LONG Term Support for the DOW exists at 16400
LONG Term Resistance for the DOW exists at 17600