For Jul, 02 2014
(Individual Chart Analysis)
This is a no-frills analysis. It is not designed
to look good, it is designed to be effective.
Summary of the Technical Analysis for the NASDAQ
(This takes into account the near term, mid term, and longer term charts)
Our combined analysis for Wednesday tells us to expect the market to begin the day with a bias to decline and if the market holds initial resistance it could fall all the way to test midterm upward sloping support lines again. For the NASDAQ, for example, midterm upward sloping support exists around 4400. A retracement to this level would satisfy an oscillation from resistance to support within the midterm chart of the NASDAQ, which is supported by a near perfect test of resistance in the S&P 500 on Tuesday. In fact, the S&P 500 increased from support to resistance within its midterm chart pattern and then began to decline from resistance. The midterm technicals of the S&P 500 have been solid, and if those continue to be solid a decline to midterm support is likely, but if that happens something else quite interesting may occur. If the S&P 500 falls back to midterm upward sloping support over the next couple of days and the NASDAQ follow, and falls to 4400 or so, a gravestone pattern will appear in the longer-term chart of the NASDAQ. We're not there yet, it has not happened, but if the markets fall back as our combined analysis currently suggests that pattern will almost surely surface. Expect immediate declines if resistance levels remain intact, and only if resistance levels break should we expect further upside from this market.
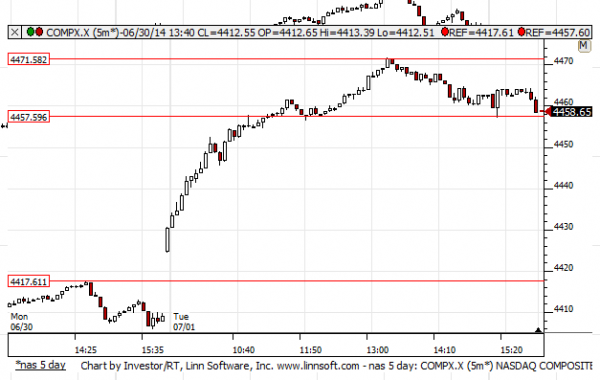
| Initial intraday trading parameters for the NASDAQ exist between4457 - 4475 |
| If 4457 breaks lower expect 4417 |
| If4475breaks higher expect 4680 |
| Otherwise expect4457 - 4475 to hold |
If 4457 remains in tact as initial support, expect the market to increase to 4475. This reflects a tight near term down channel. However, and in line with our combined analysis, if 4457 breaks lower instead expect the market to decline to 4417 before it stabilizes again.
NEAR Term Analysis
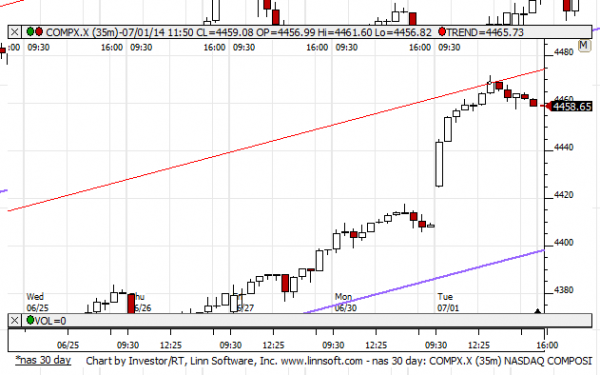
Our combined near-term analysis tells us to expect the market to begin the day with a bias to decline as it opens on Wednesday and if near-term upward sloping resistance, which was tested on Tuesday, remains intact a progression towards near-term upward sloping support should follow. However, if near-term upward sloping resistance breaks higher more steeply sloped near-term upward sloping channels are likely.
NEAR Term Support for the NASDAQ exists at 4457
NEAR Term Resistance for the NASDAQ exists at 4472
MID Term Analysis
Our combined midterm analysis tells us that midterm resistance levels were tested and the market is likely to retrace back to midterm upward sloping support if these recently tested resistance levels remain intact. The S&P 500 tested its resistance line perfectly, and although new upward sloping channels were developed in the NASDAQ and the Russell 2000, those seemed to have done the same. If the markets remain below midterm upward sloping resistance meaningful declines can follow and tests of upward sloping support can happen. Notice that upward sloping support in the NASDAQ is around 4400.
MID Term Support for the NASDAQ exists at 4398
MID Term Resistance for the NASDAQ exists at 4475
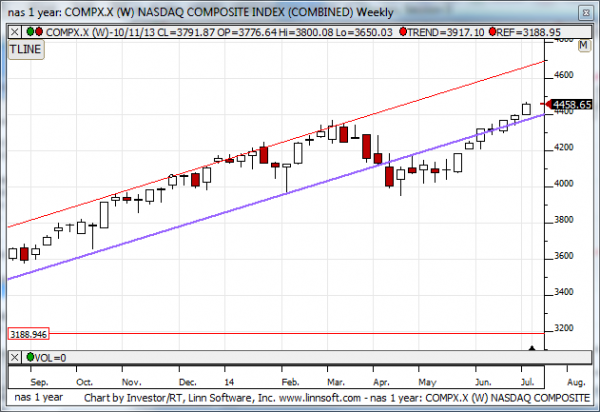
LONG Term Analysis
Our combined longer-term analysis tells us that longer-term resistance, converted resistance, was tested in the Russell 2000, but the NASDAQ is trying to break out. Only if the NASDAQ reverses completely and falls back below 4398 would our longer-term chart pattern for the NASDAQ become bearish again, but thus far the longer term pattern for the NASDAQ is positive given the break above 4398 that happened earlier in the week. If the market reverses lower that will change completely, but for now there is a positive bias from our longer term chart patterns.
LONG Term Support for the NASDAQ exists at 4000
LONG Term Resistance for the NASDAQ exists at 4398