For Jul, 08 2014
(Individual Chart Analysis)
This is a no-frills analysis. It is not designed
to look good, it is designed to be effective.
Summary of the Technical Analysis for the NASDAQ
(This takes into account the near term, mid term, and longer term charts)
Our combined analysis for Tuesday tells us to expect the market to begin the day with a bias to decline and the initial support levels in the S&P 500 and Dow Jones industrial average are extremely important. Consider 1974 in the S&P 500 to be a level of inflection. If this level remains intact the market is likely to increase again towards recent highs, it could even become bullish again, but given the observations from our midterm chart patterns a more likely scenario would suggest a break below 1974 and a progression lower towards midterm upward sloping support. Initially, this would not be a concern for the S&P 500 or Dow Jones industrial average, which seem to be in parity with each other, because those markets would simply be oscillating from midterm upward sloping resistance to midterm upward sloping support, but if that happened it could change the sentiment for the Russell 2000 and NASDAQ considerably. The Russell 2000 is already breaking its midterm upward sloping support line, and if the S&P 500 declines to test its midterm upward sloping support line the NASDAQ is likely to break as well. According to our combined analysis the S&P 500 and Dow Jones industrial average are more resilient at this time, and the initial support line in the S&P 500 will likely be and important inflection point.
| Initial intraday trading parameters for the NASDAQ exist between4424 - 4453 |
| If 4424 breaks lower expect 4342 |
| If4453breaks higher expect 4486 |
| Otherwise expect4424 - 4453 to hold |
If 4424 remains in tact as initial support, expect the market to increase to 4453. This reflects a tight near term down channel. However, and in line with our combined analysis, if 4424 breaks lower instead expect the market to decline to 4342 before it stabilizes again.
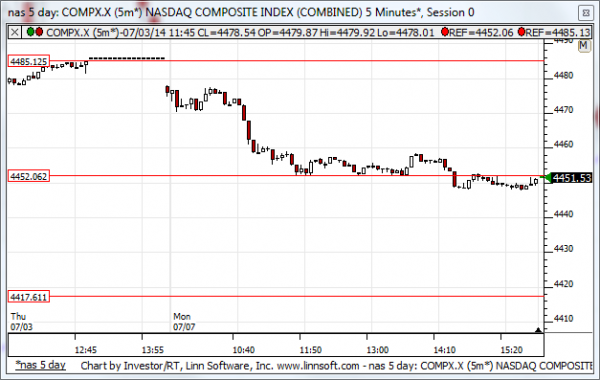
NEAR Term Analysis
Our combined near-term analysis is not outwardly concerning yet, but the Russell 2000 is now in a clear downward sloping near-term pattern, the NASDAQ is starting to break down, and if the S&P 500 and Dow Jones industrial average break their respective near term neutral support lines then concerns will exist across the board. Treat neutral near term support levels in the S&P 500 and Dow Jones industrial average as inflection and if those remain intact expect the markets to turn back towards the highest neutral resistance lines in those markets, but if those neutral support lines break lower instead momentum driven declines could exist in all markets.
NEAR Term Support for the NASDAQ exists at 4417
NEAR Term Resistance for the NASDAQ exists at 4453
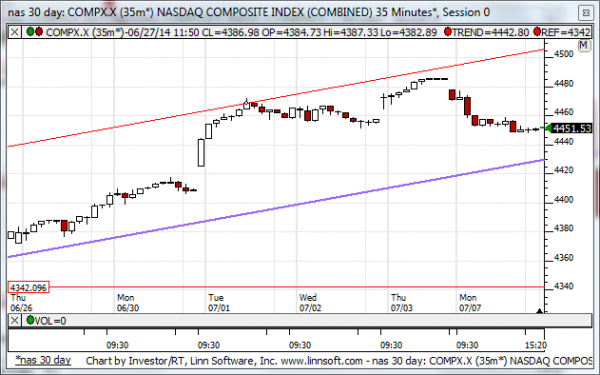
MID Term Analysis
Our combined midterm analysis tells us that the markets are progressing from midterm upward sloping resistance towards midterm upward sloping support, but the Russell 2000 is already breaking down below support. The S&P 500 and Dow Jones industrial average are further away from support than the NASDAQ is, but still these markets appear to be in the process of declining from resistance towards support. The break of support in the Russell 2000 is changing its upward sloping pattern, which was a positive bias, to neutral, and given the differential between current market levels and support in the Dow Jones industrial average and the S&P 500 vs. the NASDAQ, if the S&P 500 and Dow Jones industrial average test their respective midterm upward sloping support lines the NASDAQ will likely revert to neutral as well. For now, our combined midterm analysis is pointing towards lower levels and a test of midterm upward sloping support in the Dow Jones industrial average and S&P 500.
MID Term Support for the NASDAQ exists at 4424
MID Term Resistance for the NASDAQ exists at 4501
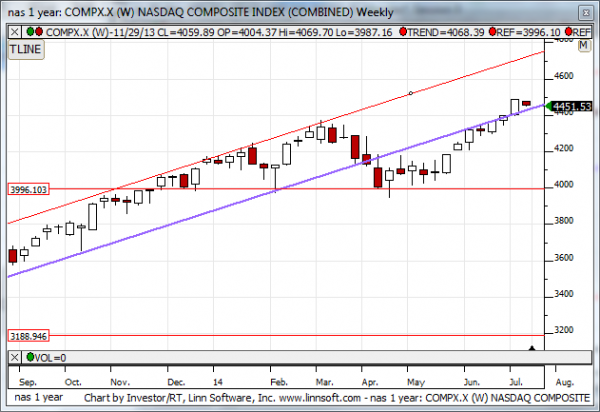
LONG Term Analysis
Our combined longer-term analysis is not bearish. In fact, except for the Russell 2000, our combined longer-term analysis has a positive tone and it is pointing towards higher levels as the S&P 500 and Dow Jones industrial average approach their longer-term resistance levels. Last week the NASDAQ broke out beyond a converted resistance level, so it is not bearish at this time either; the NASDAQ is in limbo.
LONG Term Support for the NASDAQ exists at 3996
LONG Term Resistance for the NASDAQ exists at 4440