For Jul, 11 2014
(Individual Chart Analysis)
This is a no-frills analysis. It is not designed
to look good, it is designed to be effective.
Summary of the Technical Analysis for the NASDAQ
(This takes into account the near term, mid term, and longer term charts)
Our combined analysis for Friday tells us to expect the market to begin the day with a bias to decline and if initial resistance levels remain intact the market could fall hard. The midterm sentiment has now officially changed from positive to neutral, but if the market continues to deteriorate it could also shift from neutral to bearish. Our current combined analysis suggests lower levels if initial resistance remains intact, and if that happens another test of Thursday's low should be expected. However, if initial resistance breaks higher a modest increase should be expected instead. Our inflection level is initial resistance. Additionally, the longer term charts are not outwardly bearish yet, with the exception of the Russell; and of important note the NASDAQ has fallen back below the upward sloping converted resistance line that it has recently tried to break above.
| Initial intraday trading parameters for the NASDAQ exist between4341 - 4420 |
| If 4341 breaks lower expect 3996 |
| If4420breaks higher expect 4440 |
| Otherwise expect4341 - 4420 to hold |
If 4341 remains in tact as initial support, expect the market to increase to 4420. This reflects a tight near term down channel. However, and in line with our combined analysis, if 4341 breaks lower instead expect the market to decline to 3996 before it stabilizes again.
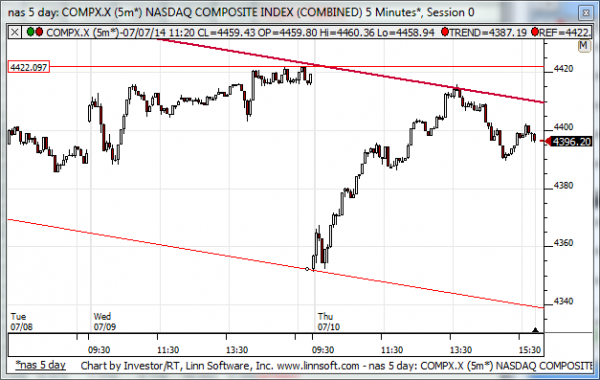
NEAR Term Analysis
Our combined near-term analysis tells us that the market is in a downward sloping near-term trading channel and it suggests that the market is in the process of declining from resistance towards support. According to our near-term analysis the market is likely to begin the day with a bias to decline as it opens on Friday and if resistance lines remain intact we should expect a test of near-term support levels afterwards. If resistance breaks higher neutral near-term patterns are likely instead.
NEAR Term Support for the NASDAQ exists at 4345
NEAR Term Resistance for the NASDAQ exists at 4417
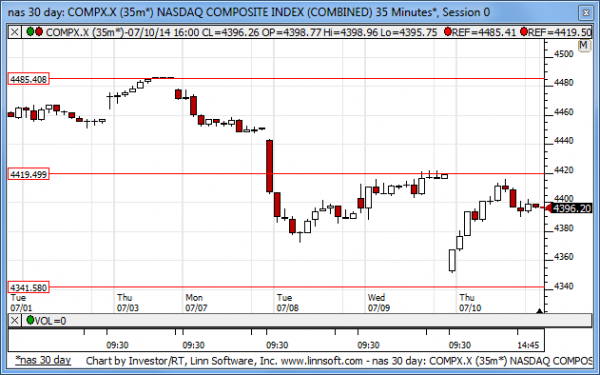
MID Term Analysis
Our combined midterm analysis tells us that the markets are changing, sentiments are changing, and although the Dow Jones industrial average is still in an upward sloping midterm channel the other markets are neutral. In fact, if the NASDAQ and Russell 2000 break below neutral support those markets could actually become quite bearish and the neutral sentiment that exists now, after the breaks that occurred on Thursday, could be followed with an additional transition to bearish. The S&P 500 is in a midterm neutral channel now that it has broken its respective midterm upward sloping support line, but it has only tested an intra channel level of support. The intra channel midterm support level in the S&P 500 is an inflection level and so long as it remains intact we should expect the market to increase back towards the highest level of neutral resistance in our charts, but the S&P 500 has not tested the lowest level of neutral support yet, and therefore our combined midterm analysis tells us to expect that if the intra channel support level that was established and tested on Thursday breaks lower.
MID Term Support for the NASDAQ exists at 4420
MID Term Resistance for the NASDAQ exists at 4486
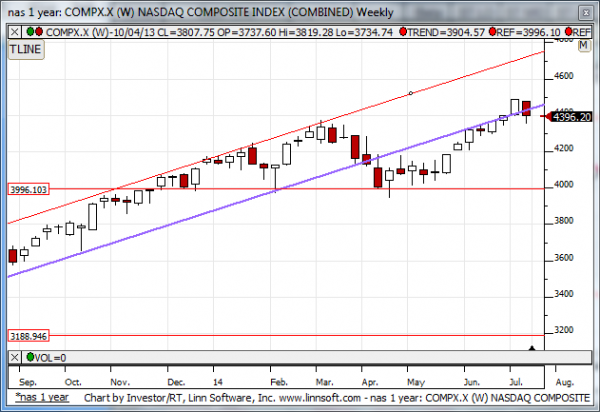
LONG Term Analysis
Our combined longer-term analysis is not yet bearish, but the big engulfing red candle in the Russell 2000 is currently bearish looking. The same could be true for other markets depending how the week closes, but for now our combined longer-term analysis is not completely bearish, with the exception of the Russell and to a certain extent the NASDAQ as well. Notice that although the NASDAQ broke beyond its respective midterm upward sloping resistance line last week, it has now fallen back.
LONG Term Support for the NASDAQ exists at 3996
LONG Term Resistance for the NASDAQ exists at 4440