For Jul, 07 2014
(Individual Chart Analysis)
This is a no-frills analysis. It is not designed
to look good, it is designed to be effective.
Summary of the Technical Analysis for the S&P 500
(This takes into account the near term, mid term, and longer term charts)
Our combined analysis for Monday tells us to expect the market to begin the day with a bias to increase and if support remains intact the market could continue to increase in the same manner that it has recently. In fact, if support levels remain intact the midterm channels are likely to become more aggressively sloped, upward sloping of course, and therefore more bullish. If the initial support levels do break lower though, that will not break the positive sentiment that exists in the midterm charts, it will only open the door for a reversion back to midterm upward sloping support. Granted, midterm upward sloping support is far enough away from midterm upward sloping resistance to make a difference here, but it would not change the sentiment on the street because an oscillation from resistance to support within an upward sloping channel will not break the channel. Therefore, although our combined analysis could call for a drop back to midterm support if initial support levels break lower, it would take more than that to create a bearish environment at this time. In fact, if initial support levels remain intact the positive tone that exists now could get even more bullish because the upward sloping midterm charts that already exist could become even steeper than they already are. Respect support accordingly and consider the market's ability or inability to hold support to be a determining factor in market direction for the days ahead.
| Initial intraday trading parameters for the S&P 500 exist between1983 - 1995 |
| If 1983 breaks lower expect 1960 |
| If1995breaks higher expect 2021 |
| Otherwise expect1983 - 1995 to hold |
If 1983 remains in tact as initial support, expect the market to increase to 1995. This reflects a tight near term down channel. However, and in line with our combined analysis, if 1983 breaks lower instead expect the market to decline to 1960 before it stabilizes again.
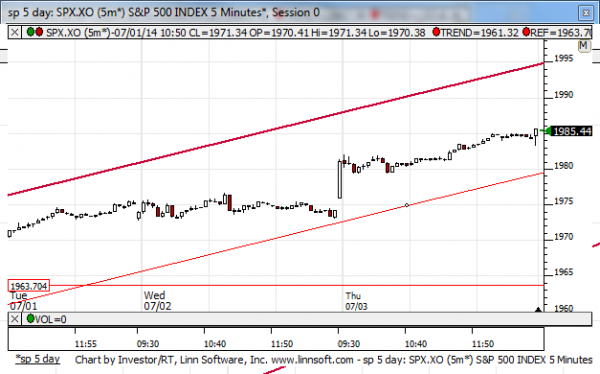
NEAR Term Analysis
Our combined near-term analysis tells us the market is an upward sloping near-term channel and if upward sloping support levels remain intact the markets are likely to begin the day Monday with a bias to increase and a test of upward sloping resistance lines is likely. If upward sloping support breaks so will the upward sloping near-term channel and a reversion to a neutral near term channel is likely instead, which would indicate a more aggressive decline because the spread between upward sloping support and neutral support is relatively wide.
NEAR Term Support for the S&P 500 exists at 1980
NEAR Term Resistance for the S&P 500 exists at 1995
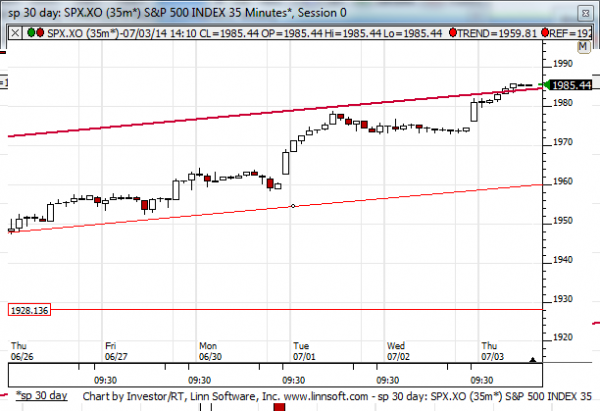
MID Term Analysis
Our combined midterm analysis tells us that the NASDAQ is at resistance, but the S&P 500 and Dow Jones industrial average closed the last session slightly above their midterm upward sloping resistance lines. If these markets fall back into their previous channel quickly than the upward sloping channels will adjust slightly and a reversion back towards midterm upward sloping support will appear likely and tests of resistance will have been deemed to have occurred. However, if the market does not do this much more aggressively sloped midterm upward sloping channels are likely to prevail, making what is now a converted upward sloping support line, the former resistance line, and important level of inflection that will likely determine sentiment in the days that follow.
MID Term Support for the S&P 500 exists at 1960
MID Term Resistance for the S&P 500 exists at 1985
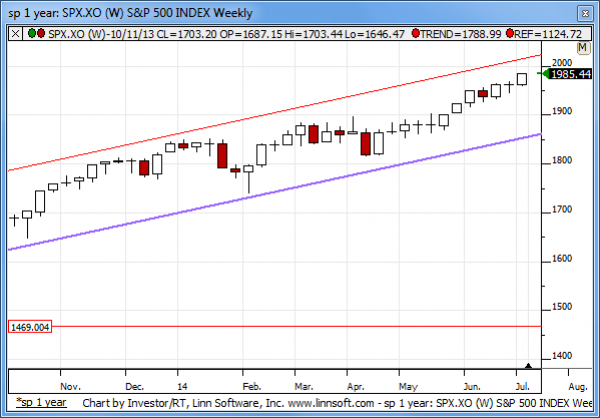
LONG Term Analysis
Our combined longer-term analysis is not bearish. In fact, except for the Russell 2000, our combined longer-term analysis has a positive tone and it is pointing towards higher levels as the S&P 500 and Dow Jones industrial average approach their longer-term resistance levels. Last week the NASDAQ broke out beyond a converted resistance level, so it is not bearish at this time either; the NASDAQ is in limbo.
LONG Term Support for the S&P 500 exists at 1855
LONG Term Resistance for the S&P 500 exists at 2021