For Jul, 23 2014
(Individual Chart Analysis)
This is a no-frills analysis. It is not designed
to look good, it is designed to be effective.
Summary of the Technical Analysis for the S&P 500
(This takes into account the near term, mid term, and longer term charts)
Our combined analysis for Wednesday suggests that the market begin the day flirting with initial levels of resistance and the ability or the inability of the market to hold resistance will likely govern trading direction for the foreseeable future. Specifically, watch 1985 in the S&P 500. If this level remains intact we should expect the market to decline to 1955. Otherwise, if 1985 breaks higher nothing is standing in the way of the S&P 500 from increasing all the way to 2030, its longer term resistance level. Either way, if 1985 holds, or if it breaks higher, the movement in the S&P 500 is likely to guide other markets as well. Therefore, we need look no further than at 1985 and the S&P 500 because the ability or the inability of the S&P 500 to hold this resistance level will likely determine market direction not only for Wednesday's trading session, but for the days and weeks that lie ahead as well.
| Initial intraday trading parameters for the S&P 500 exist between1980 - 1985 |
| If 1980 breaks lower expect 1955 |
| If1985breaks higher expect 2030 |
| Otherwise expect1980 - 1985 to hold |
If 1980 remains in tact as initial support, expect the market to increase to 1985. This reflects a tight near term down channel. However, and in line with our combined analysis, if 1980 breaks lower instead expect the market to decline to 1955 before it stabilizes again.
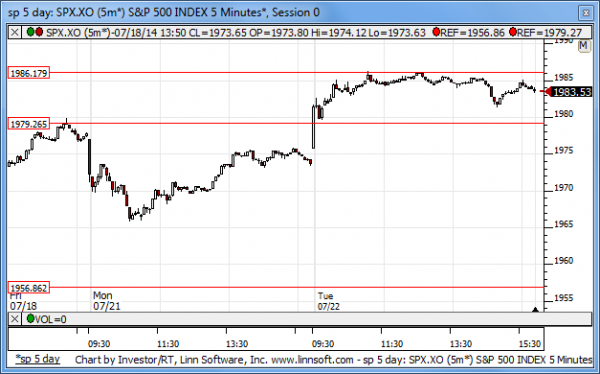
NEAR Term Analysis
Our combined near-term analysis tells us that the market is likely to begin the day flirting with initial resistance levels and initial resistance should be treated as inflection. If the market holds resistance it is capable of falling aggressively according to our near term charts, but if near term neutral resistance lines break higher we should expect upward sloping near-term patterns and an equally as aggressive market increase.
NEAR Term Support for the S&P 500 exists at 1979
NEAR Term Resistance for the S&P 500 exists at 1986
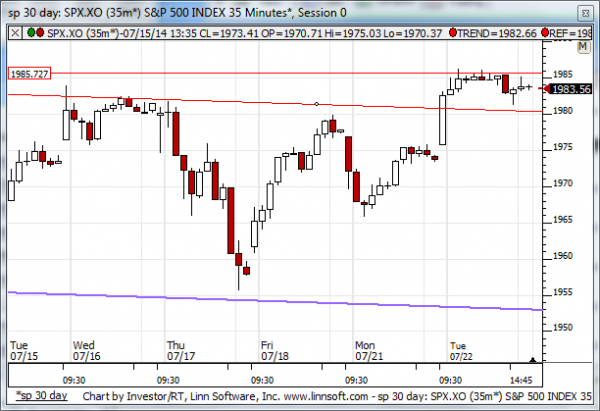
MID Term Analysis
Our combined midterm analysis tells us that the S&P 500 is flirting with 1985, and the ability or the inability of the market to break above this level will likely determine market direction for the foreseeable future. If the S&P 500 breaks above 1985 it is capable of accelerating according to our combined midterm analysis, and that would likely pull the other markets up along with it. If 1985 does not break higher a fall to 1955 should be expected.
MID Term Support for the S&P 500 exists at 1980
MID Term Resistance for the S&P 500 exists at 1985
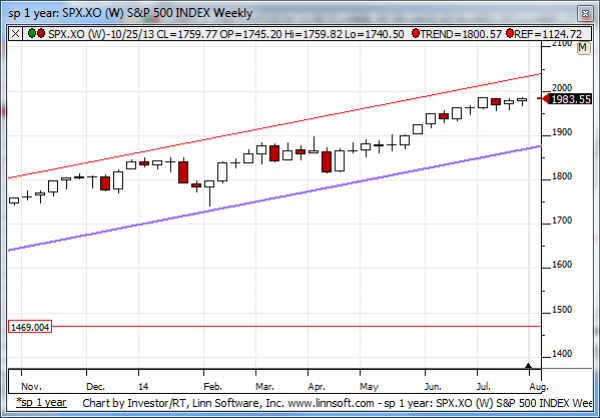
LONG Term Analysis
Our combined longer-term analysis still tells us that the Russell 2000 is bearish and the NASDAQ has fallen back, but those warnings don't exist for the S&P 500 or Dow Jones industrial average, and recent patterns suggest that the S&P 500 and Dow Jones industrial average could accelerate higher and test their longer-term resistance levels. If that happens we should expect a test of 2030 in the S&P 517,600 in the Dow Jones industrial average.
LONG Term Support for the S&P 500 exists at 1865
LONG Term Resistance for the S&P 500 exists at 2030