For Nov, 04 2014
(Individual Chart Analysis)
This is a no-frills analysis. It is not designed
to look good, it is designed to be effective.
Summary of the Technical Analysis for the NASDAQ
(This takes into account the near term, mid term, and longer term charts)
Our combined analysis for Tuesday tells us to expect the market to begin the day flirting with support and if support levels remain intact we should expect the markets to turn higher and establish higher highs. However, support is the difference between an immediately positive market environment and one that could turn sour. If support breaks lower we should expect not only neutral trading channels to develop in the midterm chart patterns, but near-term downward sloping channels could form and the market could begin to give back much of the recent increases. Treat support as inflection and respect support accordingly. Our combined analysis tells us that we should expect the market to begin the day Tuesday flirting with support, so tests of important inflection levels will likely come soon.
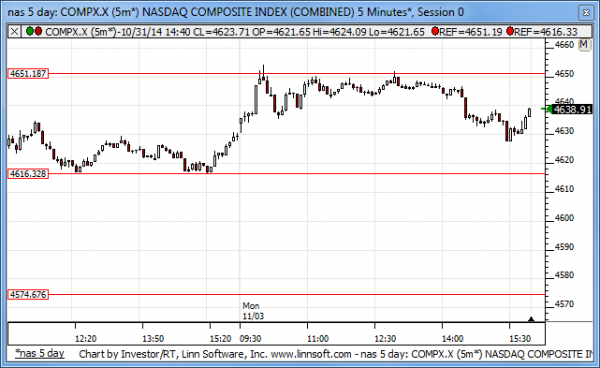
| Initial intraday trading parameters for the NASDAQ exist between4616 - 4639 |
| If 4616 breaks lower expect 4593 |
| If4639breaks higher expect 4652 |
| Otherwise expect4616 - 4639 to hold |
If 4616 remains in tact as initial support, expect the market to increase to 4639. This reflects a tight near term down channel. However, and in line with our combined analysis, if 4616 breaks lower instead expect the market to decline to 4593 before it stabilizes again.
NEAR Term Analysis
Our combined near-term analysis tells us that the market is in a near term neutral channel, resistance lines were recently tested, and the market is in the process of declining towards support. According to our combined near-term analysis the market should begin the day Tuesday with a bias to decline and a progression towards support should continue. If support remains intact we should expect the market to retrace higher again and test the near term neutral resistance lines, but if support begins to break the otherwise positive near term chart patterns that we have been witness to are likely to dissolve into downward sloping patterns.
NEAR Term Support for the NASDAQ exists at 4616
NEAR Term Resistance for the NASDAQ exists at 4652
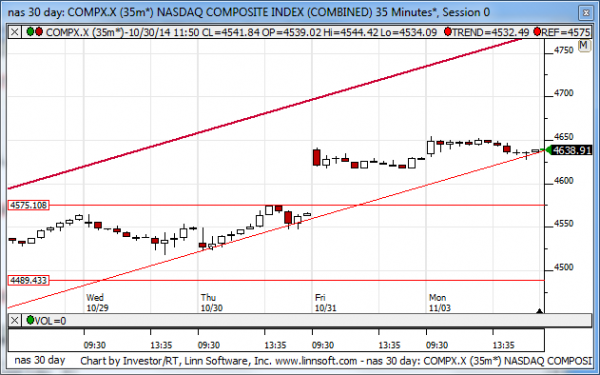
MID Term Analysis
Our combined midterm analysis tells us that the markets are still in upward sloping channels, the Dow Jones industrial average and the Russell 2000 are still declining towards support too, but the S&P 500 and NASDAQ are right on upward sloping support lines and threatening to break. If all markets break the otherwise positive bias that exists now will dissolve into neutral trading channels but if support remains intact and the markets turn higher we should expect higher highs in line with the still intact midterm upward sloping channels.
MID Term Support for the NASDAQ exists at 4575
MID Term Resistance for the NASDAQ exists at 4639
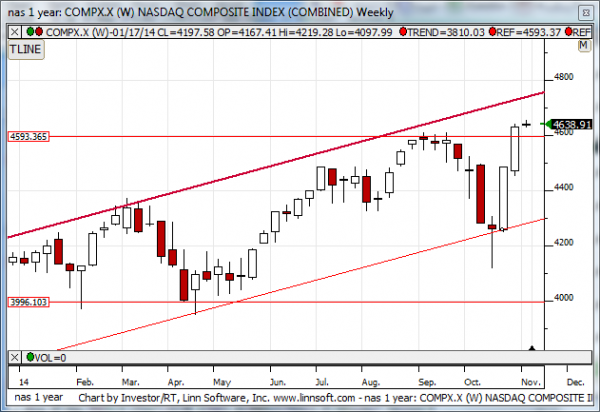
LONG Term Analysis
Our combined longer-term analysis has changed. The reversal higher in the market last week caused the patterns to change and although the markets did not RE engage the upward sloping channels that began in the early part of 2013, those are still broken and officially dissolved, new upward sloping channels developed given the bounce back that occurred from the recent drubbing. According to our combined longer-term analysis the market is now within striking distance of the new upward sloping resistance lines that exist in most markets. According to our combined longer-term analysis we should expect the market to continue to increase and test upward sloping resistance so long as it remains above the recently broken neutral resistance lines in the S&P 500, Dow Jones industrial average, and NASDAQ. These were all former highs, the market has broken above them slightly, and if the market remains above these levels a test of upward sloping resistance should be expected, but if the markets immediately break back below these now converted neutral support lines, which were once resistance, the upward sloping channels could possibly change into neutral ones. Right now, our combined longer-term analysis points to higher levels and a test of upward sloping resistance before the market pulls back towards upward sloping support again.
LONG Term Support for the NASDAQ exists at 4299
LONG Term Resistance for the NASDAQ exists at 4593