For Nov, 10 2014
(Individual Chart Analysis)
This is a no-frills analysis. It is not designed
to look good, it is designed to be effective.
Summary of the Technical Analysis for the S&P 500
(This takes into account the near term, mid term, and longer term charts)
Our combined analysis for Monday tells us to expect the market to begin the day with a bias to increase; however, it also warns us that if the market begins to pull back afterwards it may not look back for quite awhile. Our combined analysis rests on the market's ability or inability to hold resistance lines, with the understanding that midterm upward sloping channels broke lower last week. The resistance lines are the market's recent highs and given the break that has occurred in the midterm chart patterns our combined analysis warns us that a progression all the way to the midterm neutral support lines, the lowest support lines in the midterm chart patterns, is likely. However, additional support is also provided from the longer-term chart patterns, even though official tests of the upward sloping resistance lines that we have recently identified have not occurred in all markets. The take away from our combined longer-term analysis is that if the markets begin to turn down from current levels the resistance lines will be revised slightly. Whenever well established longer term channels break, like the one that began in early 2013 did recently, the channels that replace that broken channel are not always immediately identifiable. Our current longer-term combined analysis was based on upward sloping support lines, but if the market reverses lower from current levels those channels will change subtly and be based on the resistance line instead. Please refer to the educational segment on technical analysis that we provide in boot camp for details on the difference between support and resistance based trading channels. This subtle difference could make the difference between a very bearish looking market in the weeks ahead and one that continues to progress higher relentlessly. Immediately, our combined analysis tells us to watch resistance and simply to respect the market's ability or inability to hold resistance not only as an indicator for near-term trades, but as an indicator for longer-term trades as well.
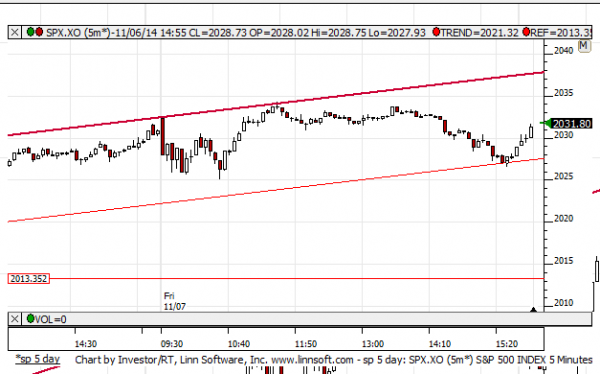
| Initial intraday trading parameters for the S&P 500 exist between2027 - 2033 |
| If 2027 breaks lower expect 2013 |
| If2033breaks higher expect 2038 |
| Otherwise expect2027 - 2033 to hold |
If 2027 remains in tact as initial support, expect the market to increase to 2033. This reflects a tight near term down channel. However, and in line with our combined analysis, if 2027 breaks lower instead expect the market to decline to 2013 before it stabilizes again.
NEAR Term Analysis
Our combined near-term analysis tells us that near-term upward sloping channels exist and the support lines have recently been tested, so if support remains intact our combined near-term analysis tells us to expect the market to begin the day with a bias to increase as it opens on Monday and it tells us to expect a test of near-term upward sloping resistance lines. If near-term support breaks lower instead expect neutral channels and a decline to neutral support instead.
NEAR Term Support for the S&P 500 exists at 2027
NEAR Term Resistance for the S&P 500 exists at 2038
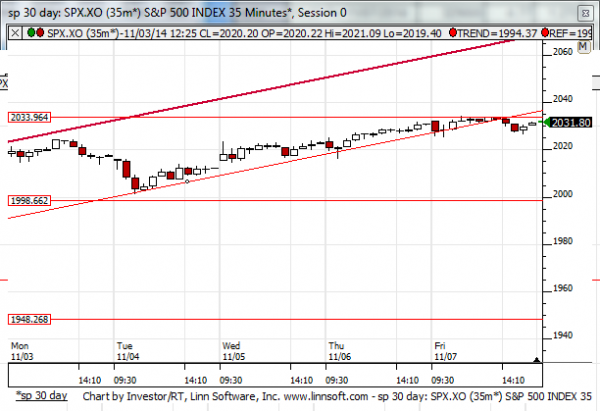
MID Term Analysis
Our combined midterm analysis tells us that the midterm upward sloping channels that have been in place have broken and neutral channels are developing, but the market is also very close to midterm neutral resistance and that makes that neutral resistance line inflection. If neutral midterm resistance remains intact we should expect the market to fall back to the lowest levels of midterm neutral support eventually, but if midterm neutral resistance breaks higher new midterm upward sloping channels will likely prevail. Our inflection catalyst is therefore the new midterm neutral resistance lines that marked the highest levels of the market recently.
MID Term Support for the S&P 500 exists at 1998
MID Term Resistance for the S&P 500 exists at 2033
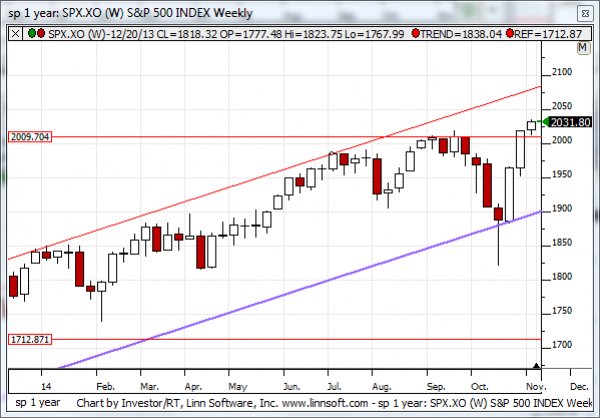
LONG Term Analysis
Our combined longer-term analysis tells us that the dow Jones industrial average is very close to longer-term upward sloping resistance, which is our upside target, and both the NASDAQ and S&P 500 have developed DOJIS after last week's action. If the market reverses down from here our combined longer-term analysis will become bearish. According to our combined longer-term analysis the market already seems to have limited upside potential given the resistance lines that it is facing, and the only way that could change is if the market breaks above these resistance lines. By rule we should expect resistance to hold unless it breaks and thus far the market is approaching resistance, it has not yet officially tested resistance, but official tests of the current upward sloping resistance line could possibly not even occur. Importantly, the longer-term upward sloping cycle that began at the beginning of 2013 broke a couple weeks ago and the market is now in a new upward sloping channel, but when channels that were so solidly defined as that one break the new channels that develop are not always crystal clear immediately. It is possible that the markets define resistance levels that are below what our revised upward sloping resistance lines indicate. To provide an example of that I have drawn a magenta upward sloping resistance line on the longer-term chart of the NASDAQ showing that the NASDAQ may indeed have already come very close to its respective revised upward sloping resistance line. When well established longer term channels break like the one we have been watching from the beginning of 2013 did recently the new channels that develop take a little time and if the market turns down from here the recent highs will indicate longer term resistance subsequently as a result.
LONG Term Support for the S&P 500 exists at 1900
LONG Term Resistance for the S&P 500 exists at 2080