For Oct, 01 2014
(Individual Chart Analysis)
This is a no-frills analysis. It is not designed
to look good, it is designed to be effective.
Summary of the Technical Analysis for the DOW
(This takes into account the near term, mid term, and longer term charts)
Our combined analysis for Wednesday tells us to expect the market to begin the day looking for direction and although support is also an important indicator for Wednesday's trading session it is the downward sloping resistance lines in the midterm chart patterns, the initial resistance levels in our combined data tables today, which are most important. If downward sloping resistance remains intact the market is not only likely to decline and make a lower low within the established midterm downward sloping trading channels, but that would also likely confirm that the tests of longer-term resistance that have already occurred are official and open the door for a pullback on a longer term basis as well. Such a pullback would be aggressive by nature, at best a correction, but it could be worse. If the market holds resistance such a confirmation can come quickly and the downside pressures can mount quickly, but if the market breaks above midterm downward sloping resistance we should expect another test of the markets all time high instead. It is resistance that we should be paying most attention to.
| Initial intraday trading parameters for the DOW exist between17005 - 17120 |
| If 17005 breaks lower expect 16855 |
| If17120breaks higher expect 17283 |
| Otherwise expect17005 - 17120 to hold |
If 17005 remains in tact as initial support, expect the market to increase to 17120. This reflects a tight near term down channel. However, and in line with our combined analysis, if 17005 breaks lower instead expect the market to decline to 16855 before it stabilizes again.
NEAR Term Analysis
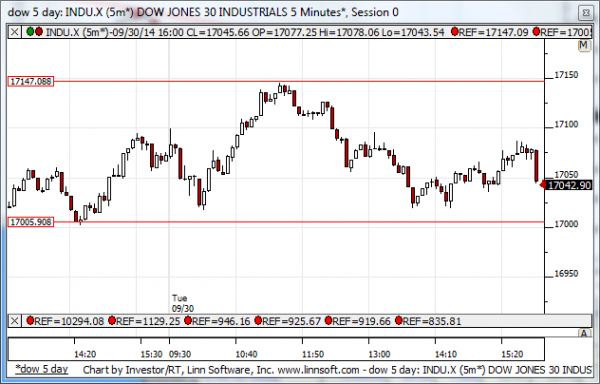
Our combined near-term analysis tells us that the market is in neutral near-term patterns, for the most part, and support was recently tested. If support remains intact our combined near-term analysis tells us to expect the market to reverse higher, it is already in the process of doing that, and proceed to test neutral near-term resistance as that is defined in most markets. However, if support breaks the existing neutral channels are likely to turn into downward sloping channels instead. Support is inflection.
NEAR Term Support for the DOW exists at 17005
NEAR Term Resistance for the DOW exists at 17147
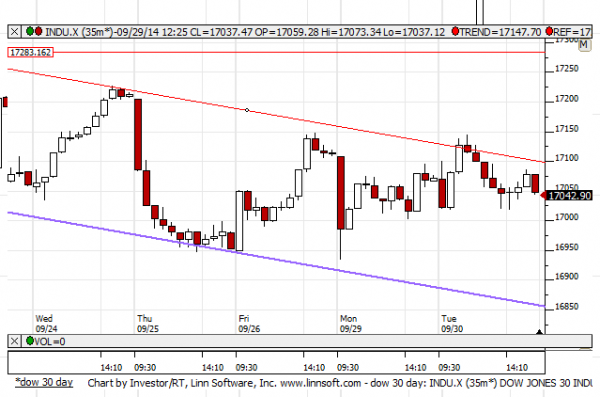
MID Term Analysis
Our combined midterm analysis tells us that downward sloping resistance lines were tested and they could be tested again, but more importantly they are inflection levels and indicative to continued trend. If these downward sloping resistance lines that exist in most markets remain intact the market is likely to turn down an established a lower low. However, if midterm downward sloping resistance breaks higher instead the market is likely to accelerate to the upside and test its all time highs again. According to our combined midterm analysis the ability of the market to hold downward sloping resistance at this time could be a leading indicator to future direction accordingly.
MID Term Support for the DOW exists at 16855
MID Term Resistance for the DOW exists at 17100
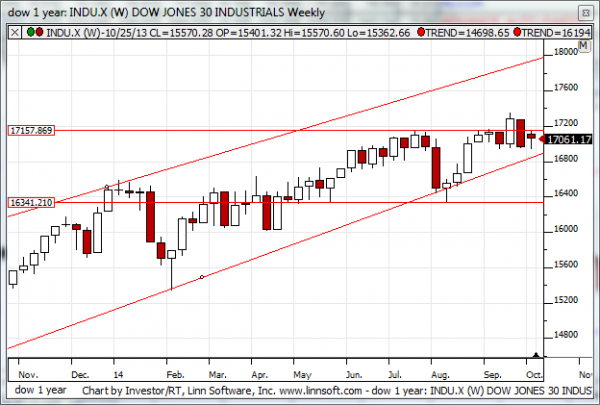
LONG Term Analysis
Our combined longer-term analysis tells us that the NASDAQ and the Russell 2000 had bearish red candles after last week's trading and that pattern is concerning. The Dow Jones industrial average reversed below 17,157 too, while the S&P 500 also reversed as shown in our longer term charts. This combination is concerning and opens the door for lower market levels but the market is still close enough to these longer-term inflection points and tests appear to still be happening. The risks are clear because under these inflection points support in the markets, the Dow Jones industrial average, S&P 500, and NASDAQ particularly, are much lower. The Russell 2000 has already fallen significantly but if it breaks support it could fall much more aggressively than it already has as well. According to our combined longer-term analysis the market is still in limbo, but after last week risks have certainly increased.
LONG Term Support for the DOW exists at 16341
LONG Term Resistance for the DOW exists at 17157