For Sep, 09 2014
(Individual Chart Analysis)
This is a no-frills analysis. It is not designed
to look good, it is designed to be effective.
Summary of the Technical Analysis for the S&P 500
(This takes into account the near term, mid term, and longer term charts)
Our combined analysis for Tuesday tells us to expect the market to begin the day looking for direction (probably closer to resistance) and it suggests that the trading range become relatively tight compared to what we have been used to. The near term charts show that the converging near term pattern has developed, which suggests the tighter trading range, but once a converging channel breaks momentum moves in the direction of the brake are likely. The sideways nature of this converging outlook is supported by the midterm chart patterns, which tell us that the market is in a state of limbo. However, the midterm charts also suggest that the markets would need to break either above midterm resistance or below the first tier of midterm support in order to move aggressively one way or the other. Right now, our combined analysis tells us to prepare for a relatively slow market environment, relatively tight trading ranges, but warns us that we should not take our eye off the ball. Soon the tight ranges will break, and when they do the market can begin to move much more aggressively in the direction of the break.
| Initial intraday trading parameters for the S&P 500 exist between1997 - 2006 |
| If 1997 breaks lower expect 1991 |
| If2006breaks higher expect 2010 |
| Otherwise expect1997 - 2006 to hold |
If 1997 remains in tact as initial support, expect the market to increase to 2006. This reflects a tight near term down channel. However, and in line with our combined analysis, if 1997 breaks lower instead expect the market to decline to 1991 before it stabilizes again.
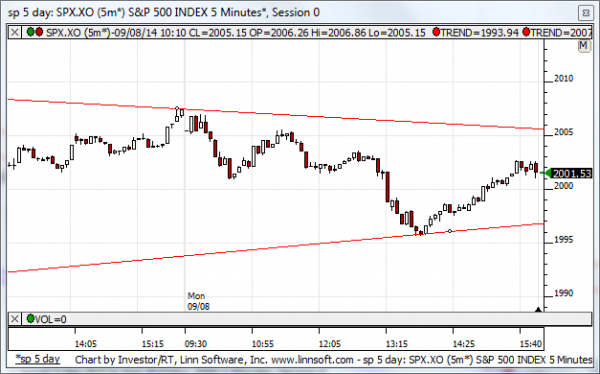
NEAR Term Analysis
Our combined near-term analysis tells us that the market is in a converging near term pattern, which means that the trading range is likely to be tighter initially, but once it breaks momentum moves in the direction of the brake are likely. Converging patterns occur when support lines converge on to resistance lines. Typically that means that support lines are upward sloping and resistance lines are downward sloping, which is the case this time.
NEAR Term Support for the S&P 500 exists at 1997
NEAR Term Resistance for the S&P 500 exists at 2006
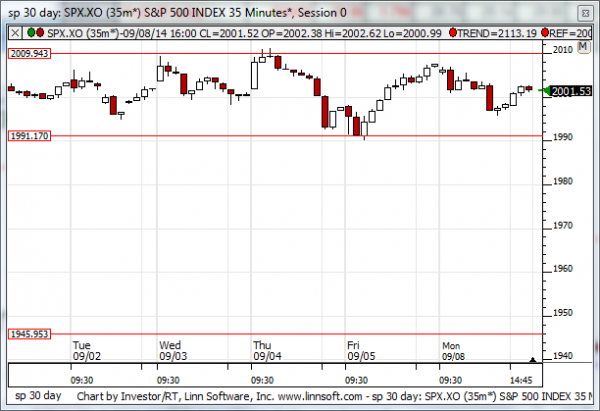
MID Term Analysis
Our combined midterm analysis tells us that the market remains in the upper range of a neutral midterm pattern, midterm resistance continues to hold, and the market has not broken down below the intra channel support line, which would need to break in order for a complete oscillation down to the lowest level of neutral support to occur. According to our combined midterm analysis the market remains in a state of limbo as it oscillates in the upper tier of this neutral channel.
MID Term Support for the S&P 500 exists at 1991
MID Term Resistance for the S&P 500 exists at 2009
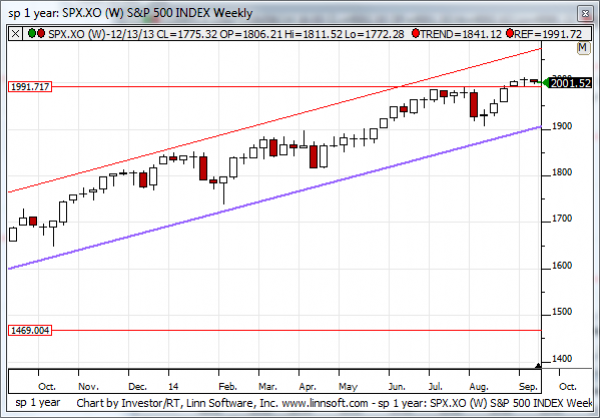
LONG Term Analysis
Our combined longer-term analysis tells us that DOJI patterns have formed in the S&P 500, NASDAQ, and Dow Jones industrial average. These developed around major inflection points, and this combination is important. However, a pattern like this does not necessarily mean that the market will turn down, every time we have seen these patterns in the past year the markets have broken out instead of reversing lower, but the combination of these potential reversal patterns and longer-term inflection points still must be respected. If the markets turn down and negatively engulfed the DOJI patterns that developed last week there will be major red flags in the longer term patterns, but if the markets breakout above the inflection parameters that they are testing now, 17157 in the Dow Jones industrial average for example, the markets may accelerate an increase by about 5%. Our longer-term analysis tells us that if these resistance levels hold and negative candles come in the week ahead the market can fall by about 7% quickly (with more over time), but if breakouts occur we should expect the market to increase by about 5%.
LONG Term Support for the S&P 500 exists at 1900
LONG Term Resistance for the S&P 500 exists at 2055