For Jan, 09 2015
(Individual Chart Analysis)
This is a no-frills analysis. It is not designed
to look good, it is designed to be effective.
Summary of the Technical Analysis for the DOW
(This takes into account the near term, mid term, and longer term charts)
Our combined analysis for Friday tells us to expect the market to begin the day flirting with initial levels of resistance and if those resistance levels hold we could experience yet another aggressive market decline because the gap in the near term chart pattern is significant. However, if the initial resistance levels, which were the highs on Thursday, break higher instead we should expect a continued progression to the midterm resistance lines offered in our midterm chart patterns. Those are also the secondary resistance levels in our combined data tables. Our immediate inflection level is initial resistance as that is offered in those same combined data tables, and the ability or the inability of the market to hold these initial resistance levels will be the guiding hand in market direction not only on Friday, but maybe for at least a couple more days as well.
| Initial intraday trading parameters for the DOW exist between17580 - 17914 |
| If 17580 breaks lower expect 17443 |
| If17914breaks higher expect 18025 |
| Otherwise expect17580 - 17914 to hold |
If 17580 remains in tact as initial support, expect the market to increase to 17914. This reflects a tight near term down channel. However, and in line with our combined analysis, if 17580 breaks lower instead expect the market to decline to 17443 before it stabilizes again.
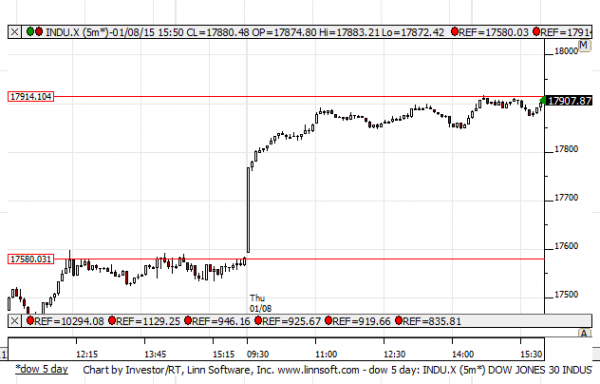
NEAR Term Analysis
Our combined near-term analysis tells us that the market is facing a neutral near-term resistance level and although this is a newly developed resistance level, if it holds the market has the potential to fall aggressively again. However, if that resistance level breaks higher a near-term upward sloping channel will likely develop, so treat the new neutral resistance line that appears in our near term chart patterns as inflection accordingly.
NEAR Term Support for the DOW exists at 17580
NEAR Term Resistance for the DOW exists at 17914
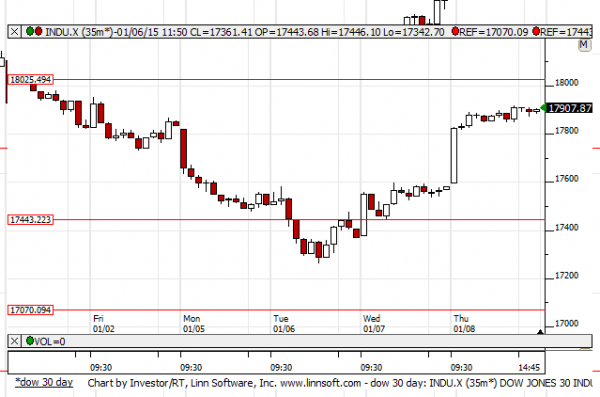
MID Term Analysis
Our combined midterm analysis tells us that the market has room to increase, the reversal back above 2012 in the S&P 500 was significant, and the markets are now within striking distance of the lower midterm neutral resistance lines. Our combined midterm analysis tells us to expect higher levels and tests of these neutral resistance lines accordingly.
MID Term Support for the DOW exists at 17070
MID Term Resistance for the DOW exists at 17443
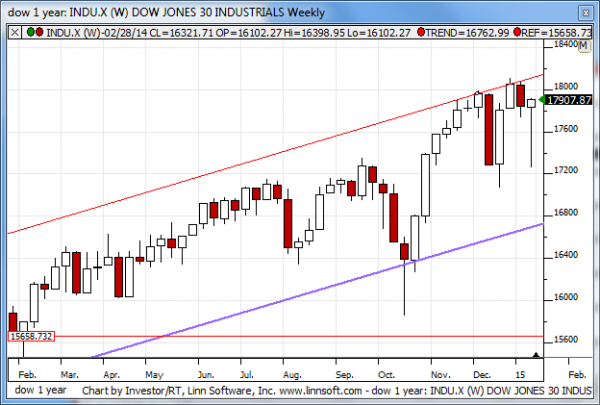
LONG Term Analysis
Our combined longer-term analysis tells us that the market's reversal so far this week has been significant and that reversal opens the door for another possible test of longer-term resistance. The week is not over, Friday's action will complete the candle for this week, but according to our combined longer-term analysis the very bearish chart pattern that existed just two days ago does not look nearly as bearish right now. Longer-term resistance is still intact, that suggests a natural oscillation down to longer term support levels again, but it is very possible that another test of longer-term resistance occurs before a decline to support happens.
LONG Term Support for the DOW exists at 16700
LONG Term Resistance for the DOW exists at 18100