For Jan, 19 2015
(Individual Chart Analysis)
This is a no-frills analysis. It is not designed
to look good, it is designed to be effective.
Summary of the Technical Analysis for the DOW
(This takes into account the near term, mid term, and longer term charts)
Our combined analysis for Tuesday tells us to expect the market to begin the day with a bias to increase and it tells us that the market should have the ability to test near term resistance levels, but the downward pressure that exists from the midterm chart patterns and the longer-term chart patterns has not gone away. On a near term basis the market has broken the downward sloping resistance lines that were intact, but the down channels that exist in our midterm chart patterns still exist, and the progression lower from longer-term resistance towards longer term support is something our longer term chart patterns tell us to continue to expect. Therefore, although the market may have some additional upside left, our combined analysis tells us that upside is likely to be short lived and the market is likely to reverse lower again eventually. If initial resistance is tested consider that to be inflection accordingly.
| Initial intraday trading parameters for the DOW exist between17250 - 17697 |
| If 17250 breaks lower expect 17110 |
| If17697breaks higher expect 17810 |
| Otherwise expect17250 - 17697 to hold |
If 17250 remains in tact as initial support, expect the market to increase to 17697. This reflects a tight near term down channel. However, and in line with our combined analysis, if 17250 breaks lower instead expect the market to decline to 17110 before it stabilizes again.
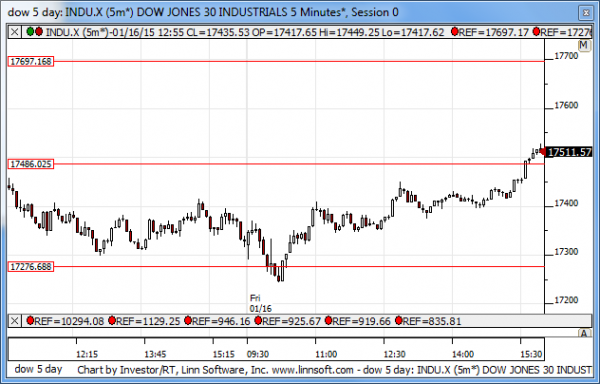
NEAR Term Analysis
Our combined near-term analysis tells us that the market is breaking above the near term down channel resistance lines that exist in all markets and that tells us to expect a progression towards the neutral resistance lines accordingly. Treat the recently broken downward sloping resistance lines, which have since been converted into support, as inflection, but expect the market to begin the day with a bias to increase as it opens on Tuesday and expect a progression towards neutral resistance unless a break below converted support occurs.
NEAR Term Support for the DOW exists at 17250
NEAR Term Resistance for the DOW exists at 17486
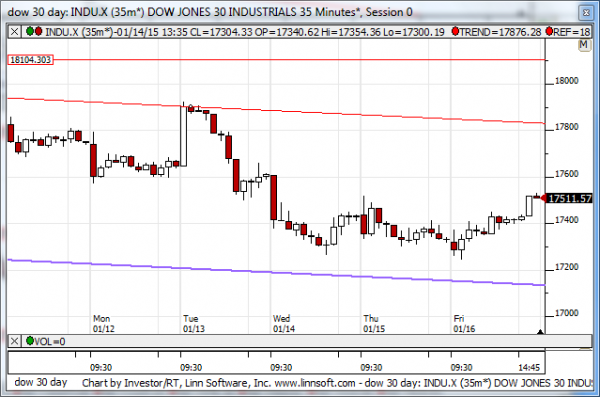
MID Term Analysis
Our combined midterm analysis tells us that the market is continuing to oscillate within the downward sloping midterm patterns we have identified, but support levels have not been tested yet. Resistance was tested most recently, so we should expect a test of midterm support next so long as the resistance lines remain intact. Those are our inflection levels, and if midterm resistance breaks higher we should expect neutral midterm patterns to develop, but thus far the downward sloping patterns are well intact.
MID Term Support for the DOW exists at 17110
MID Term Resistance for the DOW exists at 17810
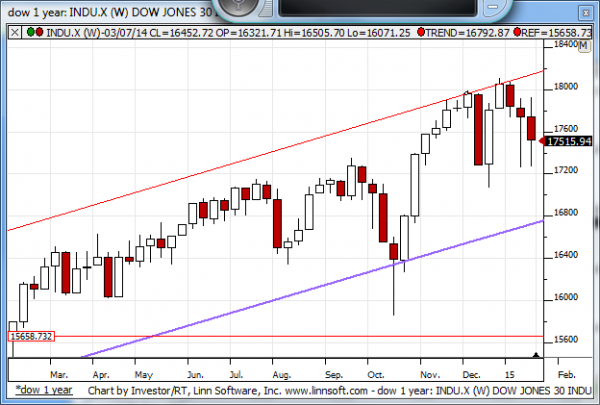
LONG Term Analysis
Our combined longer-term analysis is not as bearish as it could have been, but it's still points towards longer term support levels. The candles from last week are bearish, they are red, but they also have long legs, indicative of the bounce back that happened on Friday. If the market did not bounce back on Friday the candles would have been extremely bearish, but instead they are only somewhat bearish. Overall, our combined longer-term analysis tells us to expect lower levels and an eventual test of longer term support accordingly.
LONG Term Support for the DOW exists at 16775
LONG Term Resistance for the DOW exists at 18175