For Jan, 07 2015
(Individual Chart Analysis)
This is a no-frills analysis. It is not designed
to look good, it is designed to be effective.
Summary of the Technical Analysis for the NASDAQ
(This takes into account the near term, mid term, and longer term charts)
Our combined analysis for Wednesday tells us to expect the market to begin the day with a bias to decline and because the S&P 500 broke below 2012, it tells us that 1973 is in the cards relatively soon. Our longer term charts take that even further, and point towards 1925, but typically a progression like that requires at least a modest degree of backing and filling so we should respect the interim support levels as well. According to our combined analysis the progression is down, the chart patterns have bearish tendencies, and only if the S&P 500 breaks above 2012 again would that change, but even if that did change it would only revert to neutral. Our combined analysis is pointing towards lower levels and declines could be aggressive again, but we should use 2012 in the S&P 500 and the initial resistance levels in the other markets as inflection because a decline like that would require these resistance levels to remain intact. If they break that bearish observation will change, but if resistance remains intact our combined analysis continues to tell us to expect lower market levels.
| Initial intraday trading parameters for the NASDAQ exist between4548 - 4624 |
| If 4548 breaks lower expect 4395 |
| If4624breaks higher expect 4701 |
| Otherwise expect4548 - 4624 to hold |
If 4548 remains in tact as initial support, expect the market to increase to 4624. This reflects a tight near term down channel. However, and in line with our combined analysis, if 4548 breaks lower instead expect the market to decline to 4395 before it stabilizes again.
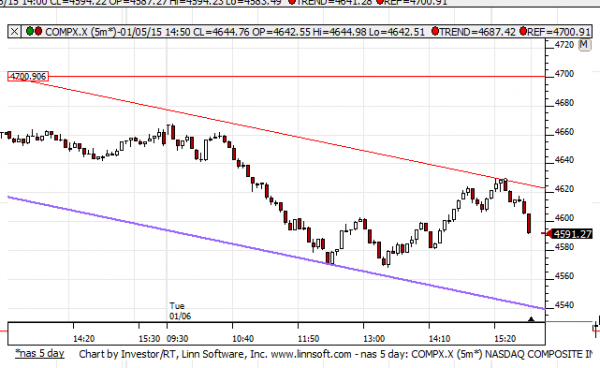
NEAR Term Analysis
Our combined near-term analysis tells us that the market is in a near-term downward sloping channel and the resistance lines of these channels have recently been tested. If resistance remains intact we should expect the market to begin the day with a bias to decline as it opens on Wednesday and a progression to near-term downward sloping support lines should be expected thereafter. Only if resistance breaks higher would this change and if it does we should expect neutral near-term patterns instead. The neutral resistance lines are offered in our near term chart patterns.
NEAR Term Support for the NASDAQ exists at 4539
NEAR Term Resistance for the NASDAQ exists at 4623
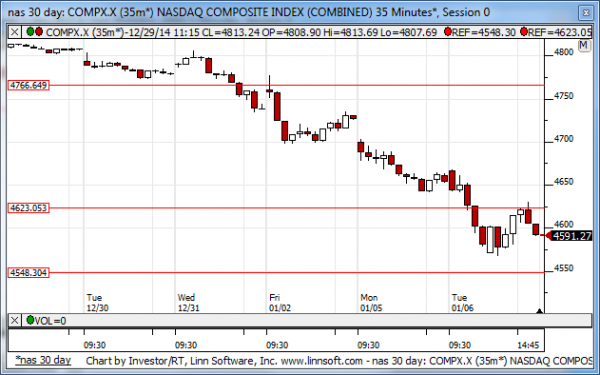
MID Term Analysis
Our combined midterm analysis has changed slightly, but still shows us that the markets are making their way down towards the lowest levels of midterm neutral support. 2012 has broken in the S&P 500, so we are using the lows that were established in the middle of December as the lowest midterm neutral support lines. The same is true for the other markets as adjustments were made there as well. Our combined midterm analysis now points to tests of those levels so long as the S&P 500 remains below 2012. 2012 is now inflection accordingly and only if the market breaks back above that level would this otherwise bearish observation change.
MID Term Support for the NASDAQ exists at 4548
MID Term Resistance for the NASDAQ exists at 4624
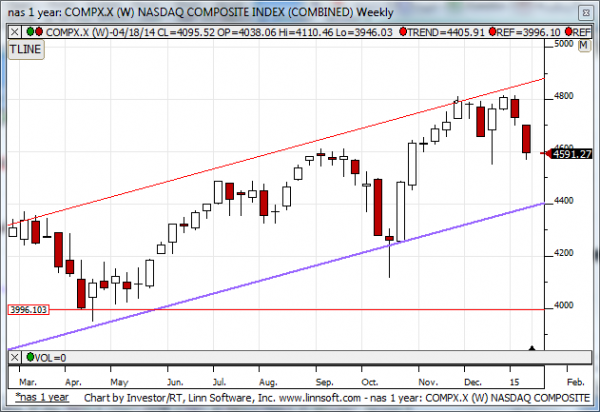
LONG Term Analysis
Our combined longer-term analysis tells us that the markets are beginning to pull back from official tests of longer term resistance and if this pullback continues a test of upward sloping support is likely. According to our combined analysis the market has already begun to pull back and our longer-term analysis tells us to expect that to continue unless the markets break above the resistance lines that were already tested. Our combined longer-term analysis does show that an upward sloping longer term patterns are intact but the oscillation from resistance to support that appears to be taking place is a bearish signal.
LONG Term Support for the NASDAQ exists at 4395
LONG Term Resistance for the NASDAQ exists at 4860