For Jan, 16 2015
(Individual Chart Analysis)
This is a no-frills analysis. It is not designed
to look good, it is designed to be effective.
Summary of the Technical Analysis for the S&P 500
(This takes into account the near term, mid term, and longer term charts)
Our combined analysis for Friday tells us to expect the market to begin the day flirting with support and if support levels remain intact it tells us to expect a nice bounce from the market. However, our midterm chart patterns tell us that the market has more room to decline before official tests of midterm support occur so if a bounce does happen before midterm support levels are tested it would be a temporary bounce given the read that is stemming from our midterm chart patterns at this time. Furthermore, our longer term charts tell us to expect declines that are even more aggressive than the midterm chart patterns suggest and an eventual test of longer term support as that is defined in our longer term chart patterns respectively. Treat initial support as inflection, recognize that the market can experience a trading bounce if support remains intact, but our midterm and longer term charts point to additional downside over time until those specific support levels are tested. In the S&P 500 that means 1964 and 1935 respectively.
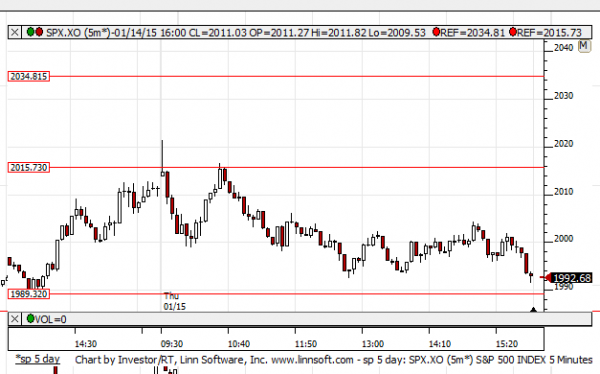
| Initial intraday trading parameters for the S&P 500 exist between1989 - 2015 |
| If 1989 breaks lower expect 1964 |
| If2015breaks higher expect 2034 |
| Otherwise expect1989 - 2015 to hold |
If 1989 remains in tact as initial support, expect the market to increase to 2015. This reflects a tight near term down channel. However, and in line with our combined analysis, if 1989 breaks lower instead expect the market to decline to 1964 before it stabilizes again.
NEAR Term Analysis
Our combined near-term analysis tells us that the markets are progressing towards near-term support, the Dow Jones industrial average and S&P 500 are in neutral channels, the NASDAQ and the Russell 2000 are in downward sloping near-term channels, support has been tested in all of the markets already, but according to our combined near-term analysis support can be tested again and it should be respected as inflection. If support holds we should expect a progression towards near-term resistance lines, but if support breaks lower instead rather aggressive declines are likely.
NEAR Term Support for the S&P 500 exists at 1989
NEAR Term Resistance for the S&P 500 exists at 2015
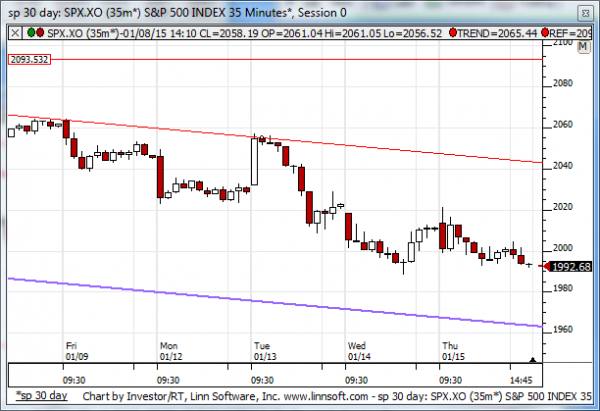
MID Term Analysis
According to our combined midterm analysis the markets are progressing lower towards midterm support levels but midterm support levels have not yet been tested. According to our combined midterm analysis we should expect them to be tested according to rule and when they are tested they should be considered inflection. If they hold we should expect the markets to turn higher and test midterm resistance levels again, but if these midterm support levels break lower much more aggressive declines can follow.
MID Term Support for the S&P 500 exists at 1964
MID Term Resistance for the S&P 500 exists at 2044
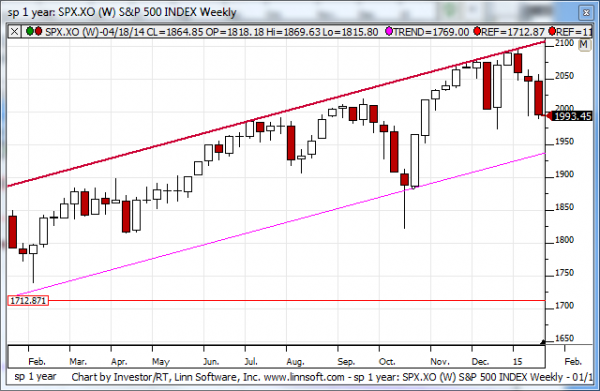
LONG Term Analysis
Our combined longer-term analysis tells us that large candles developed, with long legs, last week, and the NASDAQ formed a very large and almost perfect DOJI. The markets have all already tested longer-term resistance as well and a natural progression down to longer term support should be expected by rule, but nothing is preventing another test of resistance from occurring beforehand. Our combined longer-term analysis tells us that we should already be expecting longer term support because resistance was tested already, but if resistance is tested again another opportunity to short the market on a longer term basis will likely surface.
LONG Term Support for the S&P 500 exists at 1935
LONG Term Resistance for the S&P 500 exists at 2105