For Jan, 21 2015
(Individual Chart Analysis)
This is a no-frills analysis. It is not designed
to look good, it is designed to be effective.
Summary of the Technical Analysis for the S&P 500
(This takes into account the near term, mid term, and longer term charts)
Our combined analysis for Wednesday tells us to expect the market to begin the day with a bias to increase and it suggests that tests of near-term resistance levels take place, but that is a near-term observation and it is not supported by either the midterm or longer term observations. According to our combined analysis, as a result, any strength that might be seen in the markets at the onset on Wednesday would likely be met with selling pressure again as the market continues to decline within its existing midterm downward sloping channel. Both the midterm and longer term chart patterns suggest that the market is likely to decline over time, and in order for that to change at least midterm resistance would need to break higher, but for now the market is oscillating within that existing midterm downward sloping channel and because that channel is bearish by nature we should expect declines again if the market does increase initially as it opens on Wednesday.
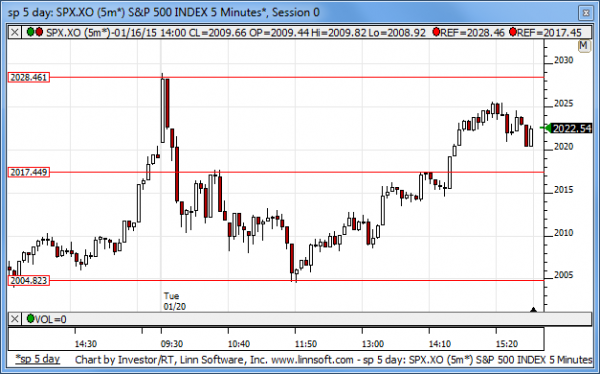
| Initial intraday trading parameters for the S&P 500 exist between2017 - 2028 |
| If 2017 breaks lower expect 2004 |
| If2028breaks higher expect 2035 |
| Otherwise expect2017 - 2028 to hold |
If 2017 remains in tact as initial support, expect the market to increase to 2028. This reflects a tight near term down channel. However, and in line with our combined analysis, if 2017 breaks lower instead expect the market to decline to 2004 before it stabilizes again.
NEAR Term Analysis
Our combined near-term analysis tells us that the market is likely to begin the day with a bias to increase as it opens on Wednesday, and although the near term chart patterns are not exactly in line with one another we can clearly see that additional upside looks likely in the Russell 2000, S&P 500, and Dow Jones industrial average. The NASDAQ has been stronger than these other markets on a near term basis, however, so if the other markets increase the NASDAQ could break resistance.
NEAR Term Support for the S&P 500 exists at 2004
NEAR Term Resistance for the S&P 500 exists at 2017
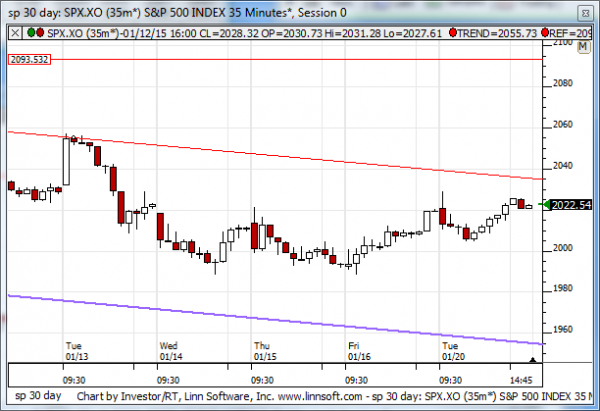
MID Term Analysis
Our combined midterm analysis tells us that the market continues to oscillate within the downward sloping midterm chart patterns that we have been observing. According to our combined midterm analysis the market is likely to continue to oscillate back and forth with in this downward sloping channel for the time being. If either resistance breaks higher or support breaks lower the existing channel is likely to change, but thus far it is well intact and downward sloping, which is relatively bearish by nature.
MID Term Support for the S&P 500 exists at 1955
MID Term Resistance for the S&P 500 exists at 2035
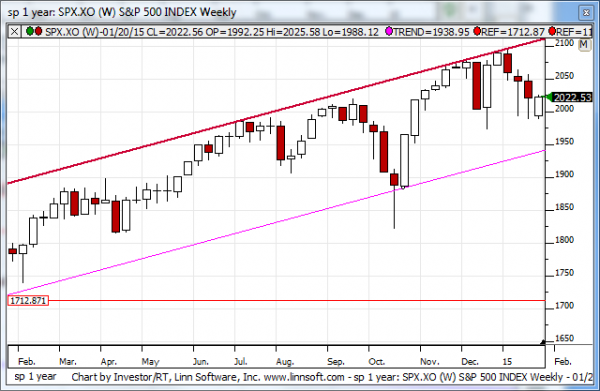
LONG Term Analysis
Our combined longer-term analysis is not as bearish as it could have been, but it's still points towards longer term support levels. The candles from last week are bearish, they are red, but they also have long legs, indicative of the bounce back that happened on Friday. If the market did not bounce back on Friday the candles would have been extremely bearish, but instead they are only somewhat bearish. Overall, our combined longer-term analysis tells us to expect lower levels and an eventual test of longer term support accordingly.
LONG Term Support for the S&P 500 exists at 1935
LONG Term Resistance for the S&P 500 exists at 2105