For Jul, 15 2015
(Individual Chart Analysis)
This is a no-frills analysis. It is not designed
to look good, it is designed to be effective.
Summary of the Technical Analysis for the DOW
(This takes into account the near term, mid term, and longer term charts)
Our combined analysis for Wednesday tells us to expect the Market to press higher, and it tells us to target midterm neutral resistance lines. The near term channels are bullish and very steep, and reasonably we could see a dip to near term up-channel support without much of a decline, but ultimately the channels are pointing towards midterm neutral resistance lines and that will be true so long as the near term support lines hold and the former levels of midterm down channel resistance that have been converted into support hold as well. Thus far that is true so our combined analysis points to higher levels.
| Initial intraday trading parameters for the DOW exist between18025 - 18092 |
| If 18025 breaks lower expect 17960 |
| If18092breaks higher expect 18181 |
| Otherwise expect18025 - 18092 to hold |
If 18025 remains in tact as initial support, expect the market to increase to 18092. This reflects a tight near term down channel. However, and in line with our combined analysis, if 18025 breaks lower instead expect the market to decline to 17960 before it stabilizes again.
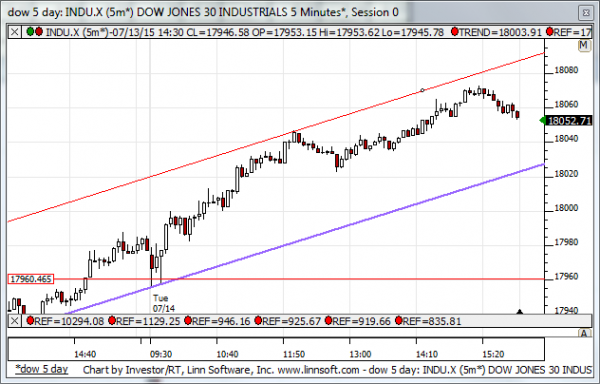
NEAR Term Analysis
Our combined near term analysis suggests that the Market is in a steep near term up-channel and it suggests that the Market is capable of increasing even more if it stays within this channel. However, because resistance was tested most recently a modest retracement is expected, but to a higher low. If that support line breaks neutral channels would develop, but for now the bias is certainly positive.
NEAR Term Support for the DOW exists at 18025
NEAR Term Resistance for the DOW exists at 18092
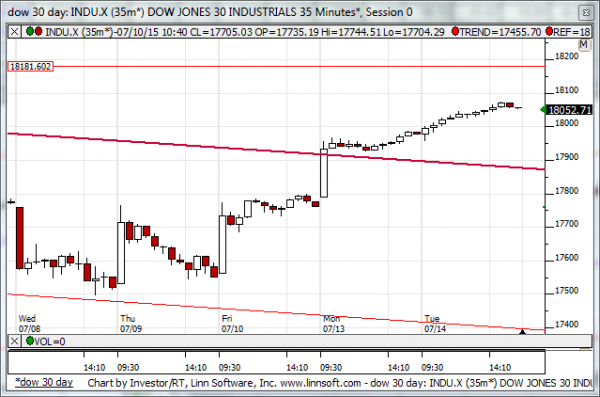
MID Term Analysis
Our combined midterm analysis suggests that the Market is heading towards midterm neutral resistance after breaking above down channel resistance lines, and that suggests higher market levels. Midterm neutral resistance is a clear inflection point, however. If it is tested there can be a material pullback, but breaks above that level would be equally as positive. Respect it either way.
MID Term Support for the DOW exists at 17875
MID Term Resistance for the DOW exists at 18181
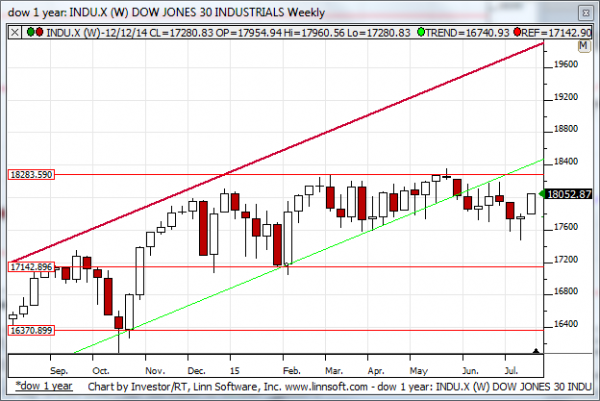
LONG Term Analysis
Our combined longer-term analysis tells us that candles are developing that would engulf the DOJIs from last week already and if this week ends anywhere close to current levels that positive engulfing candle will suggest higher market levels. Our combined longer-term analysis opens the door for a retracement higher back towards recently broken support levels accordingly.
LONG Term Support for the DOW exists at 17142
LONG Term Resistance for the DOW exists at 18283