For Jul, 17 2015
(Individual Chart Analysis)
This is a no-frills analysis. It is not designed
to look good, it is designed to be effective.
Summary of the Technical Analysis for the DOW
(This takes into account the near term, mid term, and longer term charts)
Our combined analysis for Friday tells us to expect the market to begin the day flirting with resistance levels and if resistance levels remain intact it tells us to expect the market to turn down and that would suggest a retracement all the way back towards midterm support levels again, and lower. The NASDAQ and the S&P 500 are testing neutral longer-term resistance lines, their former all time highs, and those are formidable levels of resistance, but we cannot be blind to the possibility of resistance breaking higher. Our combined analysis tells us to respect resistance and so long as it holds it tells us to expect declines that are relatively aggressive, but if resistance levels break higher the market is very capable of accelerating with momentum because in the S&P 500 and NASDAQ there are no meaningful additional resistance levels above these at this time. Respect resistance levels accordingly.
| Initial intraday trading parameters for the DOW exist between18063 - 18170 |
| If 18063 breaks lower expect 17953 |
| If18170breaks higher expect 18283 |
| Otherwise expect18063 - 18170 to hold |
If 18063 remains in tact as initial support, expect the market to increase to 18170. This reflects a tight near term down channel. However, and in line with our combined analysis, if 18063 breaks lower instead expect the market to decline to 17953 before it stabilizes again.
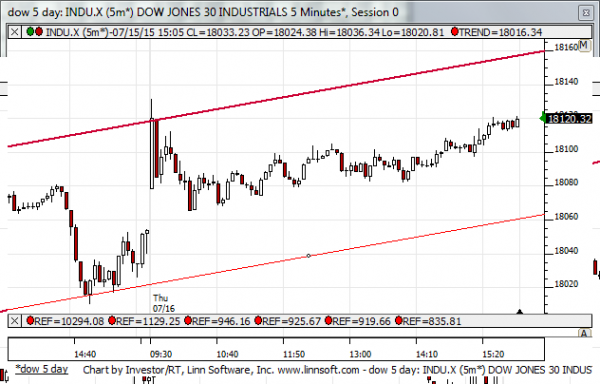
NEAR Term Analysis
Our combined near-term analysis tells us that the market is in near-term upward sloping channels and resistance lines should be respected as inflection. According to our combined near-term analysis the market is likely to flirt with resistance lines but if resistance remains intact a decline to a higher low is likely within these upward sloping channels. If resistance breaks higher the already upward sloping channels will become much steeper than they already are.
NEAR Term Support for the DOW exists at 18063
NEAR Term Resistance for the DOW exists at 18160
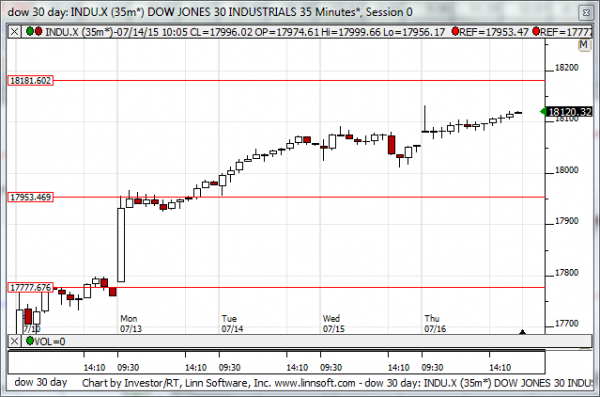
MID Term Analysis
Our combined midterm analysis tells us that the NASDAQ is testing midterm neutral resistance before the other markets, and the Dow Jones industrial average and S&P 500 have more room to increase before they test midterm neutral resistance lines officially. The NASDAQ has been stronger, it is testing neutral midterm resistance lines already, and the ability or the inability of the NASDAQ to hold resistance will likely govern direction in that market, but the other markets suggest higher levels and if that happens the probability of a breakout in the NASDAQ is also high.
MID Term Support for the DOW exists at 17953
MID Term Resistance for the DOW exists at 18181
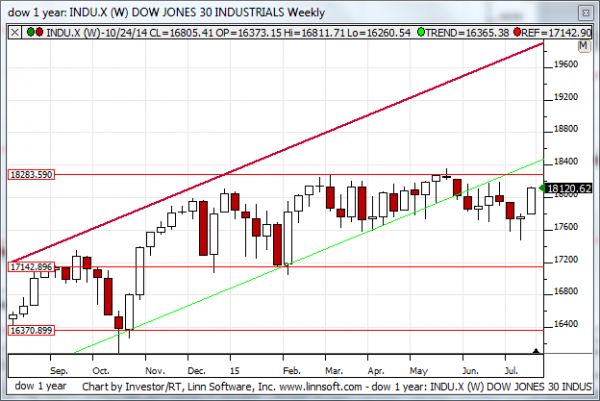
LONG Term Analysis
Our combined longer-term analysis not only shows us that positive candles exist that engulfed last week's confusion but as it stands now the NASDAQ and the S&P 500 are a short distance away from breaking out above longer term neutral resistance lines, the all time highs for those markets. Our combined analysis tells us to respect these levels as levels of resistance, formidable ones, and they have not broken yet. Friday will be a determinant and the way the market closes on Friday will likely confirm a break one way or the other.
LONG Term Support for the DOW exists at 17142
LONG Term Resistance for the DOW exists at 18283