For Jul, 06 2015
(Individual Chart Analysis)
This is a no-frills analysis. It is not designed
to look good, it is designed to be effective.
Summary of the Technical Analysis for the NASDAQ
(This takes into account the near term, mid term, and longer term charts)
Our combined analysis for Monday tells us to expect the market to begin the day looking for direction and it brings our attention to the midterm chart patterns for indications of more immediate market direction. The longer-term chart patterns are already bearish, they already tell us that breaks of longer-term upward sloping support have happened, and they already point towards a material market decline. The midterm charts, however, are neutral, and neutral support levels have been tested, so given that combined observation it is possible to see an increase back towards a lower high as that is defined in the midterm chart patterns before additional declines take place, as those would be further defined by the longer term patterns. The ability or the inability of the markets to hold neutral midterm support lines will be the deciding factor, according to our combined analysis at this time. If the markets indeed hold the support lines they have already tested then a progression to a lower high would also be expected, but if the markets fail to hold neutral midterm support the progression towards the neutral longer term support lines, which are materially lower than current market levels, should continue as the longer term charts suggest. Our combined analysis is bearish on a longer term basis given the breaks of longer-term upward sloping support but in order to be bearish on a midterm basis the neutral support lines in the midterm charts would also need to break. Because they have not broken yet our combined analysis tells us that a progression to a lower high is most likely, followed by additional market pressure, but that will change if midterm support levels break and our combined analysis will become much more bearish if that happens.
| Initial intraday trading parameters for the NASDAQ exist between4958 - 5051 |
| If 4958 breaks lower expect 4250 |
| If5051breaks higher expect 5117 |
| Otherwise expect4958 - 5051 to hold |
If 4958 remains in tact as initial support, expect the market to increase to 5051. This reflects a tight near term down channel. However, and in line with our combined analysis, if 4958 breaks lower instead expect the market to decline to 4250 before it stabilizes again.
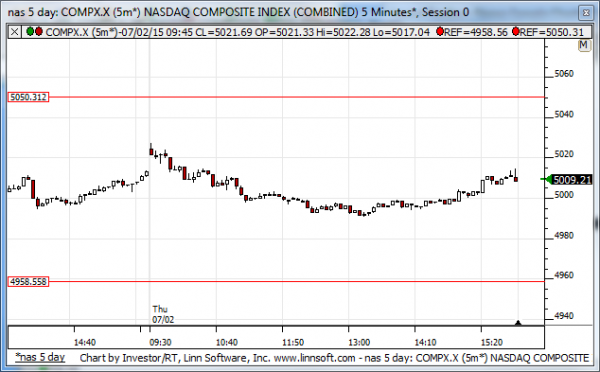
NEAR Term Analysis
Our combined near-term analysis tells us that the market is in a neutral near-term pattern that is relatively wide and it is likely to begin the day Monday within this neutral pattern as it looks for direction. The neutral support line and the neutral resistance line act as boundaries to this neutral channel and in order for the market to progress one way or the other the market will need to either break below support or above resistance. Unless that happens our combined near-term analysis tells us to expect the market to continue in a sideways fashion between these relative extremes.
NEAR Term Support for the NASDAQ exists at 4958
NEAR Term Resistance for the NASDAQ exists at 5051
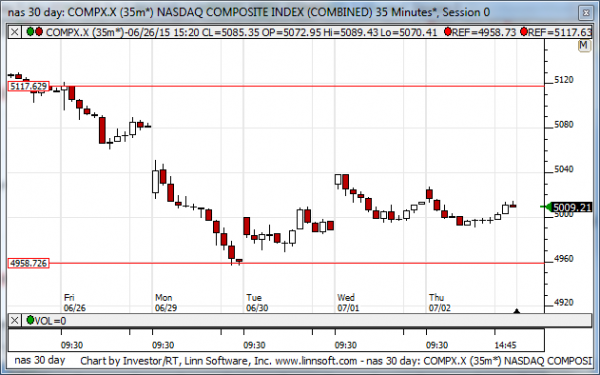
MID Term Analysis
Our combined midterm analysis tells us that the market has tested midterm support levels and if those levels remain intact the market is likely to progress higher back towards midterm resistance lines. That makes midterm support an inflection level and if it breaks lower bearish market signals will surface. Currently, our combined midterm analysis tells us to expect a progression higher towards a lower high, which could lead to a midterm downward sloping channel, but that rests on the ability of the market to hold support. If the market fails to hold midterm neutral support it could begin to decline much more aggressively.
MID Term Support for the NASDAQ exists at 4958
MID Term Resistance for the NASDAQ exists at 5117
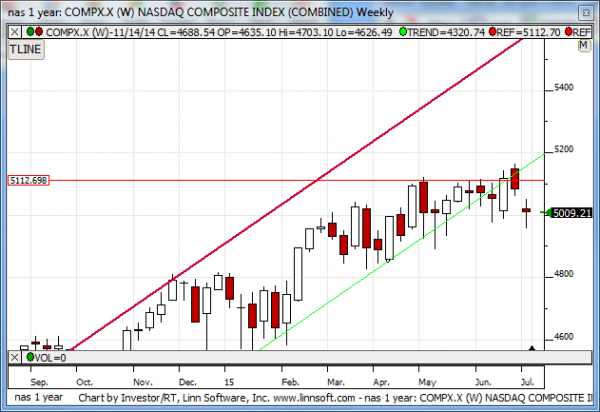
LONG Term Analysis
Our combined longer-term analysis tells us that the markets are breaking and that is a bearish sign. Our combined longer-term analysis tells us that a progression down towards neutral support lines is likely over time given the breaks of upward sloping support that are taking place and that suggests a material market decline from current levels.
LONG Term Support for the NASDAQ exists at 5112
LONG Term Resistance for the NASDAQ exists at 5200