For Mar, 17 2015
(Individual Chart Analysis)
This is a no-frills analysis. It is not designed
to look good, it is designed to be effective.
Summary of the Technical Analysis for the S&P 500
(This takes into account the near term, mid term, and longer term charts)
Our combined analysis for Tuesday tells us to expect the market to begin the day with a bias to increase and it tells us to expect the market to test resistance immediately thereafter. The stated resistance lines in our combined data tables are actionable not only on Tuesday but also for the days ahead. If the markets break above resistance they can accelerate rather aggressively because the neutral intra channel resistance lines that exist in the midterm chart patterns of the Dow Jones industrial average and S&P 500 are in the middle of the channel. This tells us that if the market breaks above this neutral intra channel resistance line it can increase again as much as it has already from recent lows as it makes its way towards the highest level of neutral resistance respectively. This observation focuses on the S&P 500 and Dow Jones industrial average, but it's important to note that the Russell 2000 is already at its highest neutral resistance line and the NASDAQ is trying to break above its neutral intra channel resistance line as well. Arguably, the Russell 2000 does look like it's struggling at its highest neutral resistance level, but the neutral resistance lines in the S&P 500 and Dow Jones industrial average are most important at this time.
| Initial intraday trading parameters for the S&P 500 exist between2066 - 2086 |
| If 2066 breaks lower expect 2041 |
| If2086breaks higher expect 2097 |
| Otherwise expect2066 - 2086 to hold |
If 2066 remains in tact as initial support, expect the market to increase to 2086. This reflects a tight near term down channel. However, and in line with our combined analysis, if 2066 breaks lower instead expect the market to decline to 2041 before it stabilizes again.
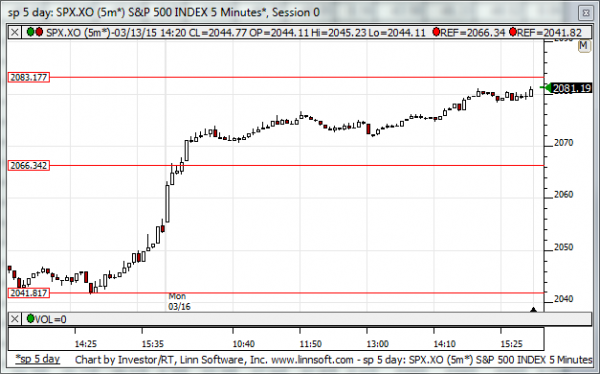
NEAR Term Analysis
Our combined near-term analysis tells us that the market is likely to start the day with a bias to increase as it opens on Tuesday and the S&P 500 and Dow Jones industrial average will likely face resistance soon thereafter if that happens. Near-term resistance lines are within reach and the ability or the inability of the market to hold resistance will likely determine market direction on Tuesday. Treat near term neutral resistance as inflection and if it holds expect a decline to neutral support, but if resistance breaks higher expect upward sloping near-term channels to form.
NEAR Term Support for the S&P 500 exists at 2066
NEAR Term Resistance for the S&P 500 exists at 2083
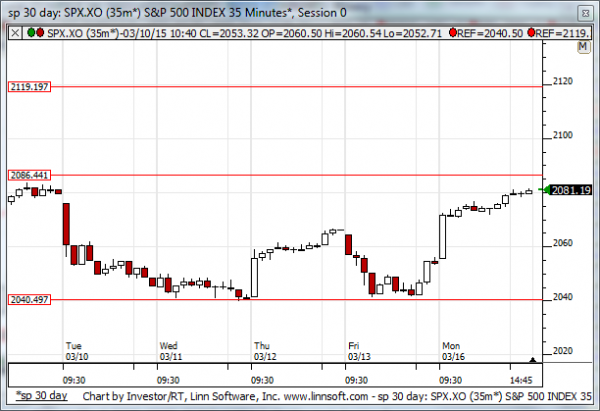
MID Term Analysis
Our combined midterm analysis tells us that the Dow Jones industrial average and S&P 500 both broke above the downward sloping resistance lines that existed in those chart patterns and neutral patterns have developed there as well. The NASDAQ is trying to break above neutral intra channel resistance, but the Russell 2000 is facing a more dominant resistance line at its highest neutral resistance line instead. Still, midterm resistance is inflection and because the lowest level of neutral support was tested most recently a progression higher to the highest level of neutral resistance now seems likely, so if the Dow Jones industrial average and S&P 500 both break above their respective midterm neutral intra channel resistance lines expect a progression to the highest neutral resistance lines in those markets, in the NASDAQ as well, and expect upward sloping midterm patterns in the Russell 2000. If the S&P 500 and Dow Jones industrial average cannot break above resistance a retracement all the way down to recent lows in all markets is likely instead.
MID Term Support for the S&P 500 exists at 2040
MID Term Resistance for the S&P 500 exists at 2086
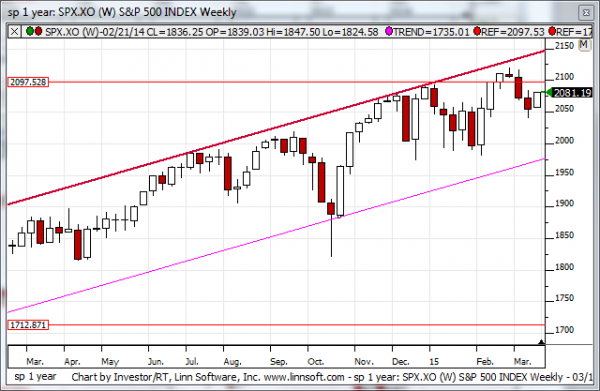
LONG Term Analysis
Our combined longer-term analysis tells us that longer-term resistance levels were tested in the NASDAQ, Dow Jones industrial average, and S&P 500, pullbacks in those markets seem to have begun, and therefore a natural progression down towards the upward sloping support lines in those longer term charts is likely, but the Russell 2000 is above its neutral intra channel support line and looking more bullish than those other markets. While the other markets tell us to expect a retracement back towards support if resistance lines remain intact, the longer-term chart pattern of the Russell 2000 tells us that the intra channel support line that has held thus far is opening the door to much higher levels if it remains intact. Our combined analysis, because most of the markets point towards lower levels, is suggesting lower levels, but we should observe what the Russell 2000 is saying.
LONG Term Support for the S&P 500 exists at 1972
LONG Term Resistance for the S&P 500 exists at 2097