For May, 04 2015
(Individual Chart Analysis)
This is a no-frills analysis. It is not designed
to look good, it is designed to be effective.
Summary of the Technical Analysis for the DOW
(This takes into account the near term, mid term, and longer term charts)
Our combined analysis for Monday tells us to expect the market to begin the day flirting with initial levels of resistance and the ability or the inability of the market to hold or break above initial resistance will likely determine market direction on Monday. According to our combined analysis the market is likely to progress higher on a midterm basis, so breaks of initial resistance are probable, but the ability of the market to break above initial resistance lines is still inflection and should be respected. Notably, our midterm charts show us that support lines were tested and they held, and longer-term upward sloping support held in the NASDAQ, Dow Jones industrial average, and S&P 500. The Russell 2000 is weaker than these other markets, it broke longer-term upward sloping support last week, but our combined analysis suggests that the other markets held support, that is a positive, and if longer term support continues to hold our combined analysis will remain positive. The immediate catalyst is intra channel resistance, initial resistance in our combined data tables, but given the successful tests of neutral midterm and longer term support lines last week the overall bias is positive.
| Initial intraday trading parameters for the DOW exist between17923 - 18027 |
| If 17923 breaks lower expect 17764 |
| If18027breaks higher expect 18137 |
| Otherwise expect17923 - 18027 to hold |
If 17923 remains in tact as initial support, expect the market to increase to 18027. This reflects a tight near term down channel. However, and in line with our combined analysis, if 17923 breaks lower instead expect the market to decline to 17764 before it stabilizes again.
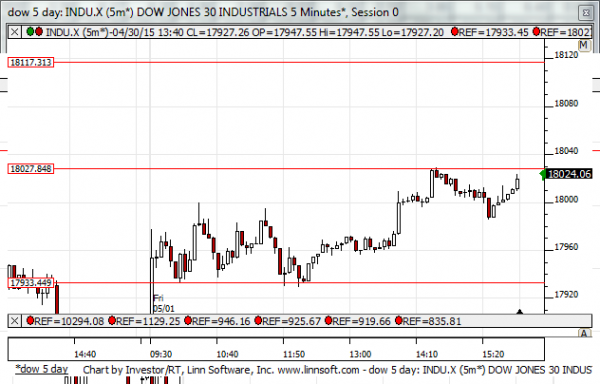
NEAR Term Analysis
Our combined near-term analysis tells us that the market is increasing from a test of near term neutral support lines and it is beginning to break above near term intra channel resistance as well. According to our combined near-term analysis the market should begin the day flirting with near term intra channel resistance lines and if the market is capable of breaking above intra channel resistance it should proceed to test the highest near term neutral resistance lines afterwards. An inability to break above intra channel resistance in all markets would add pressure and cause tests of near-term support to occur again with the risk of downward sloping near-term channels to follow. Treat near-term intra channel resistance as inflection accordingly.
NEAR Term Support for the DOW exists at 17933
NEAR Term Resistance for the DOW exists at 18027
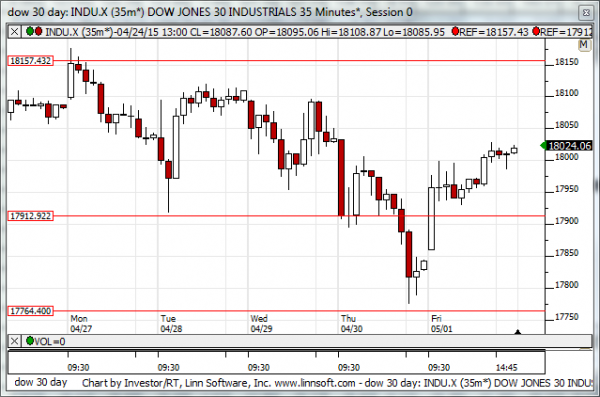
MID Term Analysis
Our combined midterm analysis tells us that the markets are increasing from tests of midterm support and if midterm support levels remain intact the market should continue to increase to test midterm neutral resistance lines again. Our combined midterm analysis is therefore positive suggesting higher levels and tests of resistance accordingly.
MID Term Support for the DOW exists at 17764
MID Term Resistance for the DOW exists at 17912
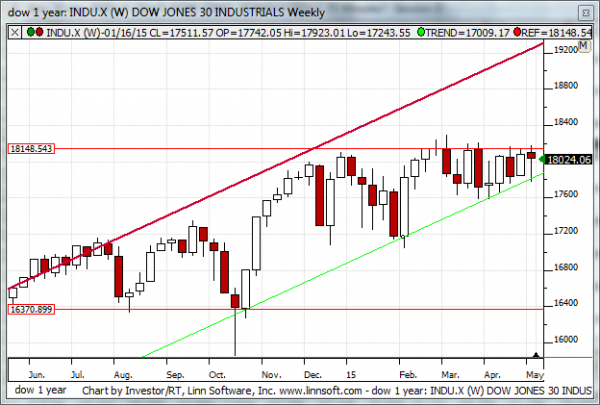
LONG Term Analysis
Our combined longer-term analysis tells us that the markets all tested longer-term upward sloping support lines, and most of them held. The NASDAQ, S&P 500, and Dow Jones industrial average each tested longer-term upward sloping support, the green upward sloping support line in our longer term charts, and all of those markets held. The Russell 2000, on the other hand, broke below longer-term upward sloping support. According to our combined longer-term analysis the market as a whole is likely to increase towards longer-term upward sloping resistance if longer-term upward sloping support remains intact. Our combined longer-term analysis is therefore positive and will continue to be positive so long as longer-term upward sloping support remains intact in the Dow Jones industrial average, S&P 500, and NASDAQ. Also, please notice that longer term upward sloping support is increasing every week.
LONG Term Support for the DOW exists at 17880
LONG Term Resistance for the DOW exists at 19320