For May, 07 2015
(Individual Chart Analysis)
This is a no-frills analysis. It is not designed
to look good, it is designed to be effective.
Summary of the Technical Analysis for the DOW
(This takes into account the near term, mid term, and longer term charts)
Our combined analysis for Thursday tells us to expect the market to begin the day with a bias to increase and it tells us that the markets have the ability to increase rather aggressively. The near-term and midterm chart patterns open the door for retracements towards recent highs, predicated on the market holding recent lows and also confirming upside by breaking above intra channel resistance lines as those are defined in both the near-term and midterm chart patterns. Most markets have recently begun to do exactly that, and that is where some of the positive attributes from our near-term and midterm chart patterns come from. However, our longer-term chart patterns are now bearish. The catch is that our longer-term chart patterns are predicated on candles that are still developing, and Friday will need to come to an end before we can say for sure whether or not our longer-term chart patterns are bearish or not. If the markets increase back to recent highs, or at least back towards recent highs, the bearish candles that we have now in our longer term charts could be reversed because the market could come back into its longer term channel before the week is over. We cannot be sure if this will happen or not, but we do know if that breaks of longer term support are happening. The week is not over, so those candles are not solidified, and with the read from the near-term and midterm chart patterns there is a strong probability that the market bounces back into its longer term channel, but because longer term support levels are breaking our combined analysis is immediately bearish and it will remain that way unless the market reverses back into its longer term channel again. Our combined analysis for Thursday tells us to expect the market to begin the day with a bias to increase, it tells us that the market could increase rather aggressively, and if that happens our combined analysis will likely skew from being bearish, but right now because longer term support levels are breaking it is bearish.
| Initial intraday trading parameters for the DOW exist between17735 - 17900 |
| If 17735 breaks lower expect 16370 |
| If17900breaks higher expect 18012 |
| Otherwise expect17735 - 17900 to hold |
If 17735 remains in tact as initial support, expect the market to increase to 17900. This reflects a tight near term down channel. However, and in line with our combined analysis, if 17735 breaks lower instead expect the market to decline to 16370 before it stabilizes again.
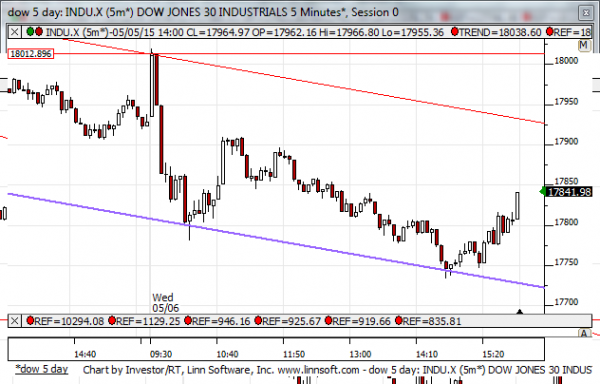
NEAR Term Analysis
Our combined near-term analysis tells us to expect the market to begin the day with a bias to increase and it tells us to expect tests of resistance in the Russell 2000, Dow Jones industrial average, and S&P 500, but the NASDAQ has begun to break above resistance already and is poised to accelerate more aggressively. Treat resistance in the other markets as inflection and consider the market's ability or inability to hold resistance to be a guiding hand in market direction accordingly. If resistance levels remain intact expect declines back to recent lows, but if the first levels of near-term resistance break higher we should be prepared for momentum market increases.
NEAR Term Support for the DOW exists at 17725
NEAR Term Resistance for the DOW exists at 17925
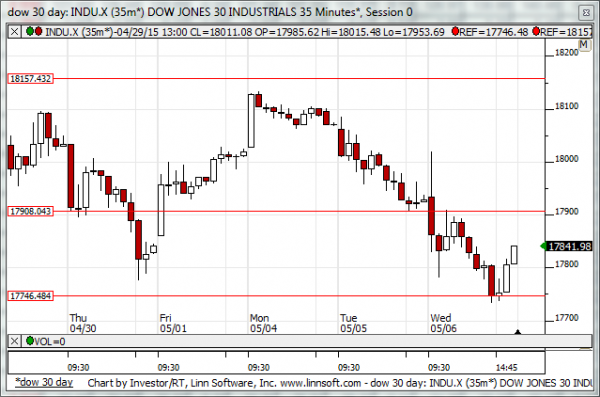
MID Term Analysis
Our combined midterm analysis is a mixed bag, but it has its share of bright spots. To begin, the Dow Jones industrial average tested its lows from April 17 perfectly and thus far it has begun to increase from those levels. This tells us that the market could increase back towards the highest resistance lines again. In addition, the NASDAQ, which is in a downward sloping midterm channel now, is breaking above a neutral intra channel confirmation level which signals that higher levels are likely there so long as it remains above this level too. The same reversal is also happening in the S&P 500, although it broke below its April 17 low for a short period on Wednesday. The only market not yet showing a positive sign is the Russell 2000, but it closed right on a downward sloping resistance level and if it breaks above that level it also will have a positive midterm chart pattern, suggesting higher levels along with the other markets.
MID Term Support for the DOW exists at 17746
MID Term Resistance for the DOW exists at 17908
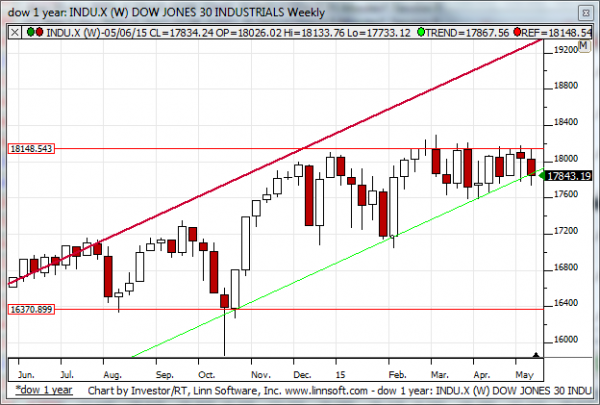
LONG Term Analysis
Our combined longer-term analysis tells us that the markets have all begun to break longer-term upward sloping support lines and if the markets ended the week at these levels it would be very bearish. The weekly candles have not finished developing, there is still a possibility that the markets recover back into their channels, but as it stands now longer-term upward sloping support is breaking and that is a bearish indicator. If longer term support remains broken our combined longer-term analysis will tell us to expect material declines back to October lows. In the S&P 500, for example, the low in October was below 1900, so if a decline like that happens from current levels it would be almost 200 S&P points. Our combined longer-term analysis is currently bearish and suggesting that declines like that can happen unless the market reverses back into its longer term pattern immediately. It would need to do this before Friday's session comes to a close; otherwise our combined longer-term analysis will be bearish and point to dramatically lower levels before neutral longer term support levels are tested.
LONG Term Support for the DOW exists at 17880
LONG Term Resistance for the DOW exists at 19320