For May, 11 2015
(Individual Chart Analysis)
This is a no-frills analysis. It is not designed
to look good, it is designed to be effective.
Summary of the Technical Analysis for the DOW
(This takes into account the near term, mid term, and longer term charts)
Our combined analysis for Monday tells us to expect the Market to begin the day flirting with initial levels of resistance and the ability or the inability of the market to hold initial resistance will likely determine market direction on Monday. If initial resistance holds we should expect the Markets to fall back and threaten longer term up-channel support lines again, but if initial resistance breaks higher the Markets could proceed to accelerate beyond the close proximity to longer term support that they are in now. A break of initial resistance could lead to momentum driven increases in the DJIA, and the S&P could promptly test its all time high levels as well. The immediate catalyst is initial resistance for Monday, but the most important catalyst is longer term support. That level was tested last week, all markets began to break, and then the markets bounced back. The NASDAQ, S&P, and DJIA ended the week above longer term support, that makes our combined longer term analysis positive, but the NASDAQ is barely above, the S&P is very close, and although the DJIA has a little more breathing room it too is too close to longer term support for comfort. Ultimately longer term support is the key, and if those levels hold our combined analysis will remain positive, but if longer term support breaks we will expect declines to October Lows.
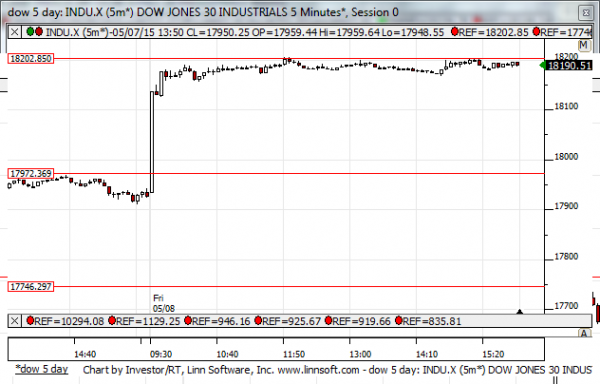
| Initial intraday trading parameters for the DOW exist between18157 - 18202 |
| If 18157 breaks lower expect 17980 |
| If18202breaks higher expect 19375 |
| Otherwise expect18157 - 18202 to hold |
If 18157 remains in tact as initial support, expect the market to increase to 18202. This reflects a tight near term down channel. However, and in line with our combined analysis, if 18157 breaks lower instead expect the market to decline to 17980 before it stabilizes again.
NEAR Term Analysis
Our combined near term analysis tells us that the Market tested near term neutral resistance on Friday, it held, but pullbacks have not yet really begun. Our combined near term analysis tells us to expect the Market to begin the day flirting with resistance as a result and the ability or inability of the market to hold resistance is likely to be a determining factor in market direction afterwards. If resistance holds a retracement to the lowest neutral support lines should be expected, but near term up-channels are likely if neutral near term resistance levels break instead.
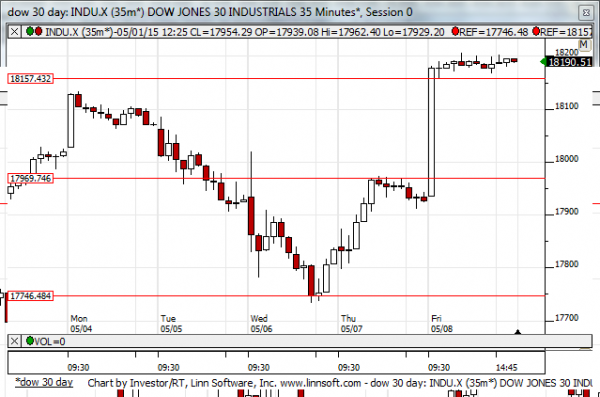
NEAR Term Support for the DOW exists at 17972
NEAR Term Resistance for the DOW exists at 18202
MID Term Analysis
Our combined midterm analysis tells us that the S&P and NASDAQ both increased to midterm down channel resistance lines, the DJIA broke above a neutral midterm resistance line, and the Russell remains below a much lower relative midterm neutral resistance line. Everything considered it is the resistance lines in the midterm patterns of the NASDAQ and the S&P that are most important. If these hold the markets are likely to fall back to lower lows, but if the midterm down channel resistance levels int he NASDAQ and the S&P break higher a progression to the highest neutral resistance levels in those charts is likely instead.
MID Term Support for the DOW exists at 17746
MID Term Resistance for the DOW exists at 17969
LONG Term Analysis
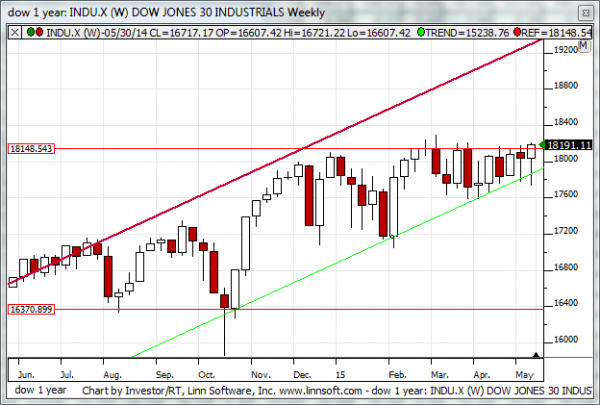
Our combined longer term analysis shows us that the NASDAQ closed a few points above longer term up-channel support, the S&P has more breathing room than the NASDAQ, but not much, but the DJIA has even more breathing room than the S&P at this time. The Russell remains broken. At the same time longer term up-channel support lines are increasing every week, and the market must continue to increase as well to prevent a break of longer term support. Thus far longer term support is holding, that makes our combined analysis positive for the time being, but the close proximity of the markets to longer term support is not calming, and complacency is not warranted. Longer term support could break with very little effort, and it must be monitored. If it holds our longer term analysis will remain positive, but if longer term support breaks and the breaks hold a decline to October lows could happen very fast.
LONG Term Support for the DOW exists at 17930
LONG Term Resistance for the DOW exists at 19375