For May, 01 2015
(Individual Chart Analysis)
This is a no-frills analysis. It is not designed
to look good, it is designed to be effective.
Summary of the Technical Analysis for the S&P 500
(This takes into account the near term, mid term, and longer term charts)
Our combined analysis for Friday tells us to expect the market to begin the day with a bias to increase and it tells us to expect tests of initial resistance levels thereafter. The markets were testing longer term support levels on Thursday, the Dow Jones industrial average and the NASDAQ have essentially held support, the S&P 500 is slightly below its longer term support level, but the longer-term candles are not complete and not until Friday comes and goes will this past week's trading activity be officially documented. The proximity of the markets to longer term support levels presents significant risks but also significant opportunities at the same time. If support levels remain intact our bias will remain positive and we will continue to expect significantly higher market levels, but if longer term support levels break our otherwise positive bias will change considerably. The market threatened to break officially on Thursday, but it did not break officially. In fact, our strategic plan strategy remains double long the Dow Jones industrial average by rule. The ability or the inability of the market to hold or break above initial resistance will likely tell us what to expect on Friday; if the markets hold resistance expect the neutral midterm support lines to be tested again, but if initial resistance breaks higher the market is capable of increasing rather aggressively on Friday. Initial resistance as that is defined in our combined data tables is the key.
| Initial intraday trading parameters for the S&P 500 exist between2075 - 2088 |
| If 2075 breaks lower expect 2000 |
| If2088breaks higher expect 2096 |
| Otherwise expect2075 - 2088 to hold |
If 2075 remains in tact as initial support, expect the market to increase to 2088. This reflects a tight near term down channel. However, and in line with our combined analysis, if 2075 breaks lower instead expect the market to decline to 2000 before it stabilizes again.
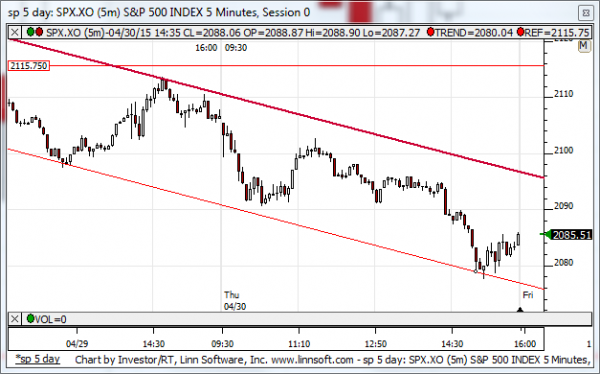
NEAR Term Analysis
Our combined near-term analysis tells us that the market is in a near-term downward sloping channel but the support line was recently tested and therefore our combined near-term analysis tells us to expect the market to begin the day with a bias to increase and a progression towards the downward sloping resistance line should be expected. If downward sloping resistance is tested and it holds and we should expect the market to turn down and test support, which would be a lower low, but if the downward sloping resistance lines break higher instead we should expect an acceleration to the neutral resistance lines in our near term chart patterns instead.
NEAR Term Support for the S&P 500 exists at 2076
NEAR Term Resistance for the S&P 500 exists at 2096
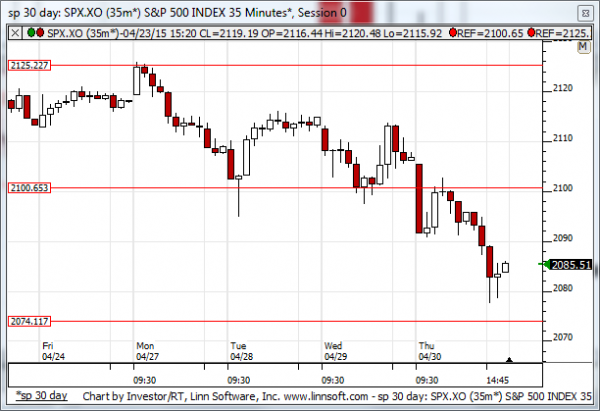
MID Term Analysis
Our combined midterm analysis shows us that the markets have all fallen into neutral midterm patterns. Neutral midterm support has also been tested in most markets. The Russell 2000 does not have a neutral support line like the other markets have, and it is the only market therefore not to test a neutral support line, but still it may be establishing one. The neutral support lines in the other markets represent levels from the 17th of April. If these levels hold the market could increase all the way back to neutral midterm resistance, but if midterm neutral support breaks as that is defined in the midterm chart patterns of the NASDAQ, Dow Jones industrial average, and S&P 500 we should brace for momentum driven declines again.
MID Term Support for the S&P 500 exists at 2074
MID Term Resistance for the S&P 500 exists at 2100
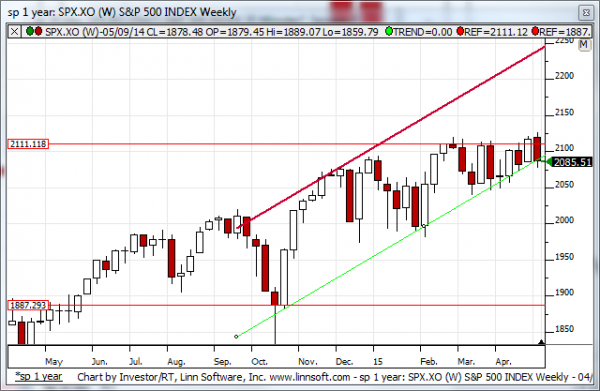
LONG Term Analysis
Our combined longer-term analysis shows us that the dow Jones industrial average tested and is thus far holding longer term support, the NASDAQ tested and it is right at longer term support, and the S&P 500 tested and it is fractionally below longer term support as that is stated in our longer term charts for each of these markets. The Russell 2000 broke, but the other markets are essentially holding and that means our combined longer-term analysis is still maintaining an overall positive bias. If Friday comes and goes and longer term support levels remain intact our combined longer-term analysis will remain positive, but if the candles that make up this week's trading activity show us that breaks of longer term support levels have happened it will paint a very bearish picture instead. Our combined longer-term analysis tells us we're right on the cusp of longer term support, as of the close of the market on Thursday. The ability or inability of the market to hold longer term support is the key to our sentiment.
LONG Term Support for the S&P 500 exists at 2088
LONG Term Resistance for the S&P 500 exists at 2238