For May, 19 2015
(Individual Chart Analysis)
This is a no-frills analysis. It is not designed
to look good, it is designed to be effective.
Summary of the Technical Analysis for the S&P 500
(This takes into account the near term, mid term, and longer term charts)
Our combined analysis for Tuesday tells us that the markets may begin the day flirting with breaks above near term resistance, but the midterm charts are now upward sloping and pointing to higher levels, and the longer term support levels have held thus far too, adding to the positive tone. Our combined analysis tells us to expect the markets to progress back towards midterm resistance lines now that these new midterm up-channels form, and although some backing and filling should take place along the way, further increases to longer term resistance levels also seem probable. Our combined analysis is positive, longer term support has been tested; midterm up-channels developed, and if the markets can comfortably break near term up-channel resistance lines more rapid increases could follow.
| Initial intraday trading parameters for the S&P 500 exist between2125 - 2132 |
| If 2125 breaks lower expect 2116 |
| If2132breaks higher expect 2156 |
| Otherwise expect2125 - 2132 to hold |
If 2125 remains in tact as initial support, expect the market to increase to 2132. This reflects a tight near term down channel. However, and in line with our combined analysis, if 2125 breaks lower instead expect the market to decline to 2116 before it stabilizes again.
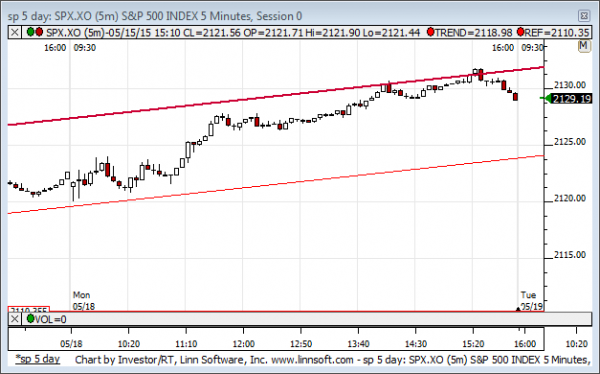
NEAR Term Analysis
Our combined near term analysis tells us that the Market is in a near term up-channel and it is in the process of increasing towards up-channel resistance. If up-channel resistance lines hold we should expect the Market to trend lower again and back to support, a higher low by definition, but if this resistance level breaks much more aggressively sloped near term channels can follow.
NEAR Term Support for the S&P 500 exists at 2125
NEAR Term Resistance for the S&P 500 exists at 2132
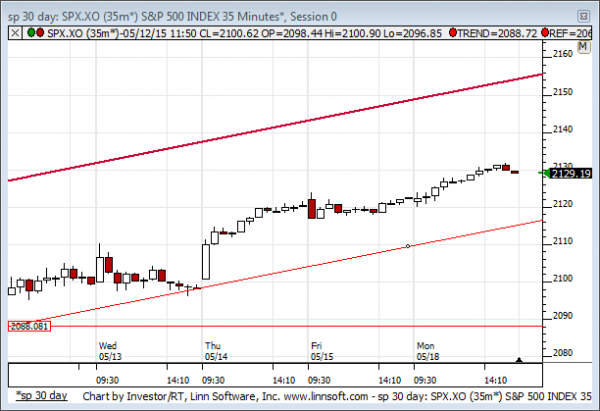
MID Term Analysis
Our combined midterm analysis tells us that the Market has developed midterm up-channels and the S&P and DJIA have more room to increase than the NASDAQ appears to have, but all markets seem to have upside potential given the newly formed up-channels and the tests of support that had taken place.
MID Term Support for the S&P 500 exists at 2116
MID Term Resistance for the S&P 500 exists at 2156
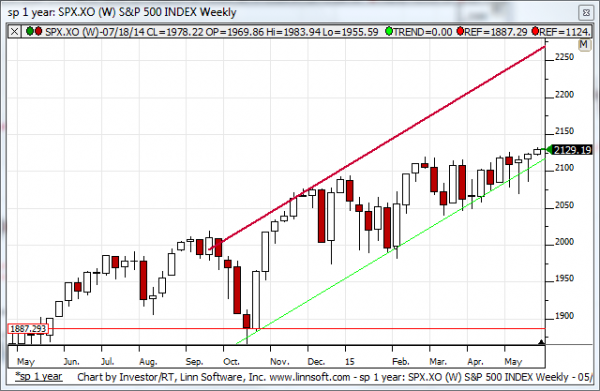
LONG Term Analysis
Our combined longer term analysis tells us that longer term up-channel support has held and if that continues to be true we should expect the market to accelerate towards longer term resistance again over time. However, longer term resistance is moving higher every day and slight declines in the market could cause breaks to happen. For now our combined longer term analysis is positive, but because longer term up-channel support continues to increase the market would need to continue to increase every week in order for that to be maintained.
LONG Term Support for the S&P 500 exists at 2111
LONG Term Resistance for the S&P 500 exists at 2261