For May, 20 2015
(Individual Chart Analysis)
This is a no-frills analysis. It is not designed
to look good, it is designed to be effective.
Summary of the Technical Analysis for the S&P 500
(This takes into account the near term, mid term, and longer term charts)
Our combined analysis for Wednesday tells us to expect the Market to begin the day flirting with breaks back below support levels, the DJIA has actually begun to break midterm support slightly already, but our combined analysis is not bearish on a near or midterm basis because more markets would need to join in breaking for that to happen. Thus far the DJIA has weaker qualities, which is different than recently because it was strongest until just recently, but our combined analysis on a near or midterm basis will not become concerning simply because of the DJIA alone. If the other markets join the DJIA and offer concerning near and midterm signals too there could easily be another test of longer term support given the close proximity of the market to longer term support still (S&P specifically), but in order for our overall bias to change longer term support would also need to break. So far longer term support is holding, that means our underlying bias will be positive unless longer term support breaks, and if it breaks the change would be decidedly so, but it has not broken. The only concerns exist on a midterm and near term basis, the strongest market has begun to break trend, and that is notable.
| Initial intraday trading parameters for the S&P 500 exist between2121 - 2137 |
| If 2121 breaks lower expect 2116 |
| If2137breaks higher expect 2162 |
| Otherwise expect2121 - 2137 to hold |
If 2121 remains in tact as initial support, expect the market to increase to 2137. This reflects a tight near term down channel. However, and in line with our combined analysis, if 2121 breaks lower instead expect the market to decline to 2116 before it stabilizes again.
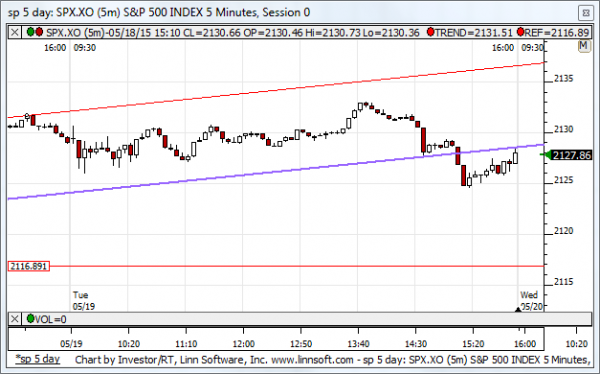
NEAR Term Analysis
Our combined near term analysis tells us to expect the Market to begin the day flirting with breaks of initial support and the ability or inability of the market to hold support will likely be the determining factor in market direction on Wednesday. If support holds expect a market bounce to the near term resistance lines, but if near term support begins to break more rapid deterioration can follow.
NEAR Term Support for the S&P 500 exists at 2119
NEAR Term Resistance for the S&P 500 exists at 2137
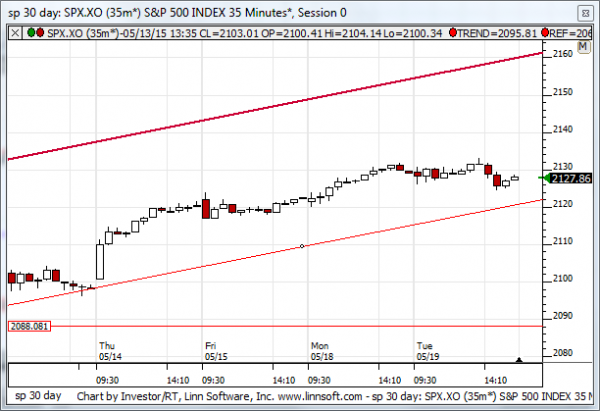
MID Term Analysis
Our combined midterm analysis tells us that the DJIA is threatening to break midterm up-channel support. The other markets have not, they are holding so far, but the slight breaks in the DJIA are a concern. The DJIA has been strongest, and it has begun to break. Our combined midterm analysis is not bearish just because the DJIA has begun to break back, and that's because the other markets are not doing that, they are holding, but if they begin to break too, following the lead of the DJIA, our combined midterm analysis can become bearish.
MID Term Support for the S&P 500 exists at 2122
MID Term Resistance for the S&P 500 exists at 2162
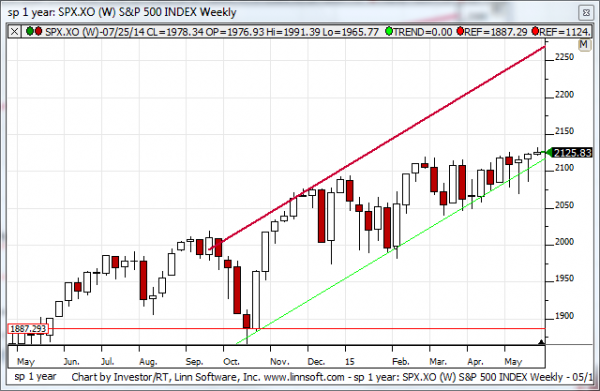
LONG Term Analysis
Our combined longer term analysis tells us that longer term up-channel support has held and if that continues to be true we should expect the market to accelerate towards longer term resistance again over time. However, longer term resistance is moving higher every day and slight declines in the market could cause breaks to happen. For now our combined longer term analysis is positive, but because longer term up-channel support continues to increase the market would need to continue to increase every week in order for that to be maintained.
LONG Term Support for the S&P 500 exists at 2111
LONG Term Resistance for the S&P 500 exists at 2261