For Nov, 03 2015
(Individual Chart Analysis)
This is a no-frills analysis. It is not designed
to look good, it is designed to be effective.
Summary of the Technical Analysis for the DOW
(This takes into account the near term, mid term, and longer term charts)
Our combined analysis for Tuesday tells us to expect the market to begin the day flirting with initial levels of resistance and the ability or the inability of the market to hold resistance will likely determine whether or not the market oscillates back down to near-term upward sloping support before moving higher, or if the market accelerates more immediately. Initial resistance is an up-side confirmation catalyst defined by the near term chart patterns. The midterm chart patterns already point to higher levels, with breakouts happening in the Russell 2000, but in order for the markets to successfully increase they will need to break above initial resistance as that is defined in our combined data tables. Initial resistance represents near-term resistance levels and those levels were being tested and in some cases broken on Monday, but all markets would need to break near-term upward sloping resistance for upside confirmation catalysts to surface. The near term charts are upward sloping, so if they hold our combined analysis would simply suggest that a decline to higher lows take place before a continuation to midterm upward sloping resistance lines happen, but still initial resistance levels should be considered inflection and the ability or the inability of the market to hold resistance considered a catalyst. If resistance levels break target midterm upward sloping resistance, the second resistance levels in our combined data tables for the NASDAQ, S&P 500, and Dow Jones industrial average respectively.
| Initial intraday trading parameters for the DOW exist between17725 - 17905 |
| If 17725 breaks lower expect 17548 |
| If17905breaks higher expect 18125 |
| Otherwise expect17725 - 17905 to hold |
If 17725 remains in tact as initial support, expect the market to increase to 17905. This reflects a tight near term down channel. However, and in line with our combined analysis, if 17725 breaks lower instead expect the market to decline to 17548 before it stabilizes again.
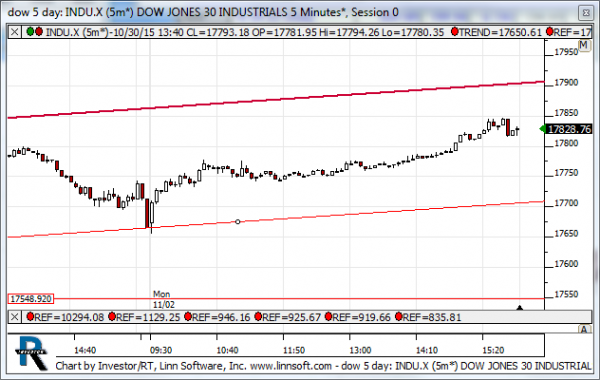
NEAR Term Analysis
Our combined near-term analysis tells us that the market is in an upward sloping near-term channel and resistance should be treated as inflection. The NASDAQ is testing resistance; the Russell 2000 is breaking above resistance slightly, while the S&P 500 and Dow Jones industrial average are both approaching their respective near-term upward sloping resistance levels. In all cases resistance should be treated as inflection and if it remains intact as resistance we should expect a natural oscillation back down towards upward sloping support, but if near-term resistance levels break higher be prepared for aggressive market increases afterwards.
NEAR Term Support for the DOW exists at 17705
NEAR Term Resistance for the DOW exists at 17905
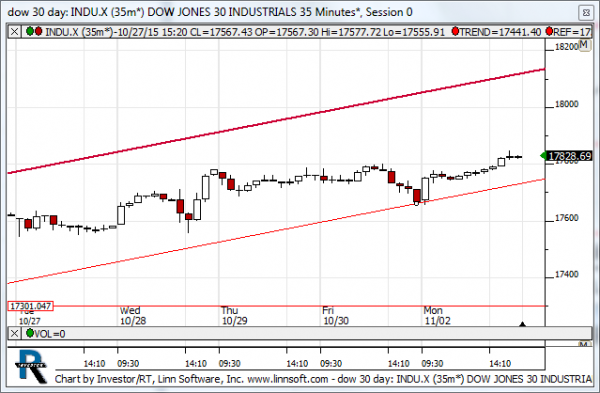
MID Term Analysis
Our combined midterm analysis tells us that support levels were tested in all markets except the Russell 2000. The Russell 2000 has actually broken above resistance and it looks stronger on a relative basis. The tests of support in the other markets also open the door for higher market levels so long as those support levels continue to hold. If they do we should see a natural progression back towards the upward sloping resistance lines in the Dow Jones industrial average, S&P 500, and NASDAQ, but if those upward sloping support lines break lower, however, neutral midterm channels are likely in those markets instead. Currently, our combined midterm analysis is positive.
MID Term Support for the DOW exists at 17750
MID Term Resistance for the DOW exists at 18125
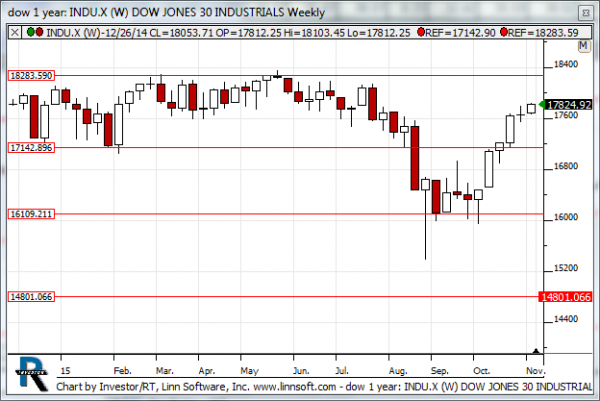
LONG Term Analysis
Our combined longer term analysis shows us that there are DOJIs int he chart patterns of the DJIA, S&P, and Russell, but the NASDAQ is not presenting us with those same reversal triggers on a longer term basis. The Russell remains under its neutral intra channel resistance line, while the other markets remain higher. The combination that we are seeing tells us that the markets could easily fall back down towards converted neutral support from current levels before bouncing back (if those support levels hold).
LONG Term Support for the DOW exists at 16109
LONG Term Resistance for the DOW exists at 17142