For Nov, 17 2015
(Individual Chart Analysis)
This is a no-frills analysis. It is not designed
to look good, it is designed to be effective.
Summary of the Technical Analysis for the DOW
(This takes into account the near term, mid term, and longer term charts)
Our combined analysis for Tuesday tells us to expect the Market to begin the day with a bias to increase as it opens, and with a little push higher a new round of momentum increases could follow. The midterm charts tell us that the Markets established and tested midterm neutral support, and that supports the case for an eventual test of the market's recent highs as well, which are neutral resistance. Our combined analysis is positive as a result, but the lows set on Monday must hold for that positive sentiment to hold. If they break it could get ugly again, but it's positive now because thus far those support levels are holding.
| Initial intraday trading parameters for the DOW exist between17392 - 17680 |
| If 17392 breaks lower expect 17225 |
| If17680breaks higher expect 17972 |
| Otherwise expect17392 - 17680 to hold |
If 17392 remains in tact as initial support, expect the market to increase to 17680. This reflects a tight near term down channel. However, and in line with our combined analysis, if 17392 breaks lower instead expect the market to decline to 17225 before it stabilizes again.
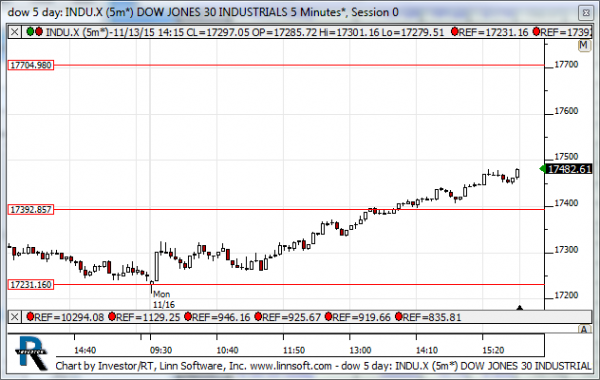
NEAR Term Analysis
Our combined near term analysis tells us that the lowest near term support levels were tested, and the market has already begun to increase towards the highest resistance levels, but it is facing intra channel resistance levels in the NASDAQ and Russell now. The DJIA and S&P have already broken above their intra channel resistance levels, suggesting the other markets could do the same, but intra channel resistance is still inflection in the NASDAQ and Russell. Of those hold expect the market to stall, but if the NASDAQ and Russell follow the S&P and DJIA expect aggressive increases.
NEAR Term Support for the DOW exists at 17231
NEAR Term Resistance for the DOW exists at 17392
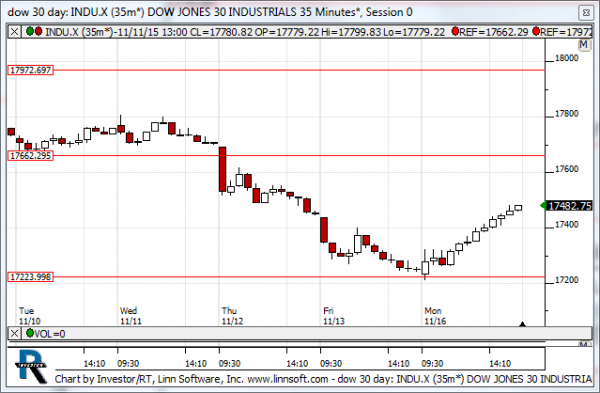
MID Term Analysis
Our combined midterm analysis tells us to expect the market to trend higher from current levels because new neutral support levels were tested. We are likely to get a stall at intra channel resistance lines, but our combined midterm analysis tells us to expect a progression towards the highest midterm neutral resistance levels eventually.
MID Term Support for the DOW exists at 17223
MID Term Resistance for the DOW exists at 17662
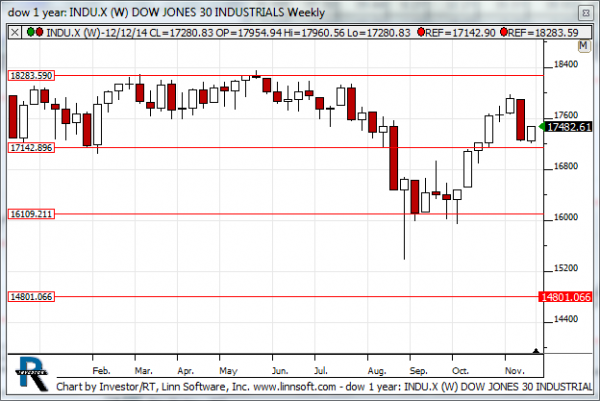
LONG Term Analysis
Our combined longer term analysis tells us that the Markets are all close to their longer term intra channel support levels again. The S&P came very close to 2128 about 10 days ago, and that level held as resistance, and the S&P along with the other markets are now very close to testing intra channel support. That is major inflection and it needs to hold or the tones will become much more bearish. If the S&P breaks 1990, for example, a 100 point decline can follow.
LONG Term Support for the DOW exists at 16109
LONG Term Resistance for the DOW exists at 17142