For Nov, 16 2015
(Individual Chart Analysis)
This is a no-frills analysis. It is not designed
to look good, it is designed to be effective.
Summary of the Technical Analysis for the NASDAQ
(This takes into account the near term, mid term, and longer term charts)
Our combined analysis for Monday tells us to expect the Market to begin the day with a bias to decline and it tells us that the Market could experience yet another eye-opening initial decline given the diverging near term channels that have developed. The support lines of the near term channels are diverging from the parallel trend and that is a very bearish pattern, and it's happening while the S&P and DJIA break midterm support levels too. However, if the longer term charts play a role, as they usually do, the declines from resistance (2128 in the S&P) to intra channel support that will likely act as a level of important inflection. 1990 is support in the S&P's long term chart. Acco5ding to our combined analysis it would not be out of trend for the S&P to come close to that level as it opens on Monday. If support levels hold that will tell us to be buyers, but if they break the bearish tones will manifest.
| Initial intraday trading parameters for the NASDAQ exist between4921 - 4948 |
| If 4921 breaks lower expect 4873 |
| If4948breaks higher expect 5009 |
| Otherwise expect4921 - 4948 to hold |
If 4921 remains in tact as initial support, expect the market to increase to 4948. This reflects a tight near term down channel. However, and in line with our combined analysis, if 4921 breaks lower instead expect the market to decline to 4873 before it stabilizes again.
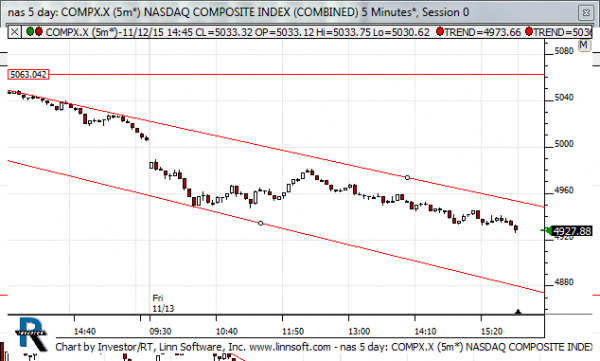
NEAR Term Analysis
Our combined near term analysis tells us that resistance lines were tested most recently in a diverging near term channel, and as a result a progression towards support is likely as the market opens on Monday. Treat resistance as inflection because if resistance breaks higher the weakness can be thwarted, but the diverging near term down channels are currently bearish and point to lower levels as Monday begins.
NEAR Term Support for the NASDAQ exists at 4873
NEAR Term Resistance for the NASDAQ exists at 4948
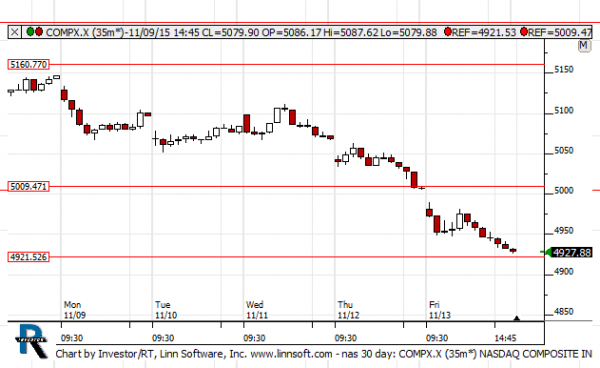
MID Term Analysis
Our combined midterm analysis tells us that midterm neutral support is breaking in the S&P and DJIA, but the NASDAQ and Russell are still holding. The declines to support have happened, and now we are in the process of seeing if support lines hold. Right now our combined midterm analysis is not decisive.
MID Term Support for the NASDAQ exists at 4921
MID Term Resistance for the NASDAQ exists at 5009
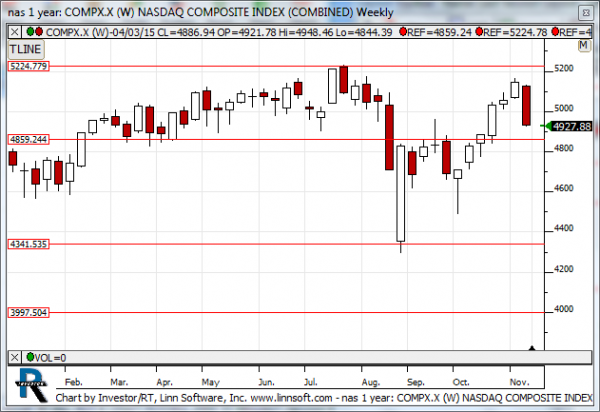
LONG Term Analysis
Our combined longer term analysis tells us that the Markets are all close to their longer term intra channel support levels again. The S&P came very close to 2128 about 10 days ago, and that level held as resistance, and the S&P along with the other markets are now very close to testing intra channel support. That is major inflection and it needs to hold or the tones will become much more bearish. If the S&P breaks 1990, for example, a 100 point decline can follow.
LONG Term Support for the NASDAQ exists at 4859
LONG Term Resistance for the NASDAQ exists at 5225