For Nov, 18 2015
(Individual Chart Analysis)
This is a no-frills analysis. It is not designed
to look good, it is designed to be effective.
Summary of the Technical Analysis for the NASDAQ
(This takes into account the near term, mid term, and longer term charts)
Our combined analysis for Wednesday tells us that the Market is likely to begin the day flirting with initial support levels, and some markets have already begun to break, but these are derived from the near term charts and the midterm charts are more prominent. The observations are opposite between the near term and midterm charts, where the near term charts tell us that near term resistance was tested and near term intra channel support is now being tested, but the midterm charts tell us that midterm support was tested and midterm intra channel resistance is being tested. The dominance of the midterm charts suggests that if midterm resistance, which is essentially near term resistance, the resistance levels from Tuesday, breaks higher another test of the recent market highs is likely. On the other hand, if the markets fail to break midterm intra channel resistance, and thus far they are failing to do that, they run the risk of re-testing the lows set on Monday.
| Initial intraday trading parameters for the NASDAQ exist between4978 - 5018 |
| If 4978 breaks lower expect 4910 |
| If5018breaks higher expect 5035 |
| Otherwise expect4978 - 5018 to hold |
If 4978 remains in tact as initial support, expect the market to increase to 5018. This reflects a tight near term down channel. However, and in line with our combined analysis, if 4978 breaks lower instead expect the market to decline to 4910 before it stabilizes again.
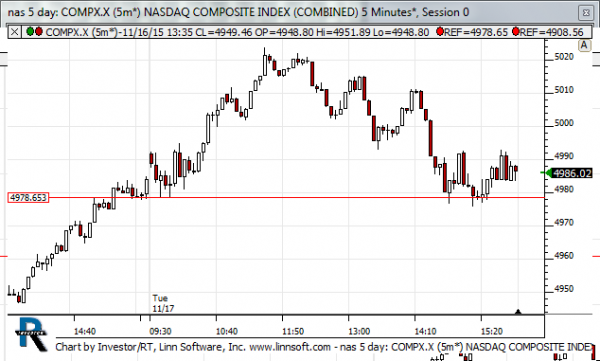
NEAR Term Analysis
Our combined near term analysis tells us that the market has tested near term resistance and it appears to be in the process of declining back towards support again. At this time intra channel support levels are being tested and the ability or the inability of the market to hold intra channel support will likely be the determining factor between another test of the lowest neutral support lines and potential near term up-channels. Respect the intra channel support lines accordingly.
NEAR Term Support for the NASDAQ exists at 4908
NEAR Term Resistance for the NASDAQ exists at 4978
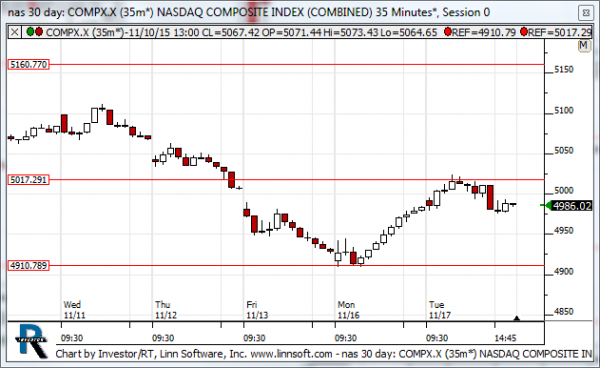
MID Term Analysis
Our combined midterm analysis tells us that the markets have tested midterm intra channel resistance levels and they have pulled back some from those tests. The midterm charts do tell us that a continuation to the highest neutral midterm resistance levels is likely if these levels break, otherwise another test of the lowest support levels is likely. Respect midterm intra channel resistance accordingly.
MID Term Support for the NASDAQ exists at 4910
MID Term Resistance for the NASDAQ exists at 5018
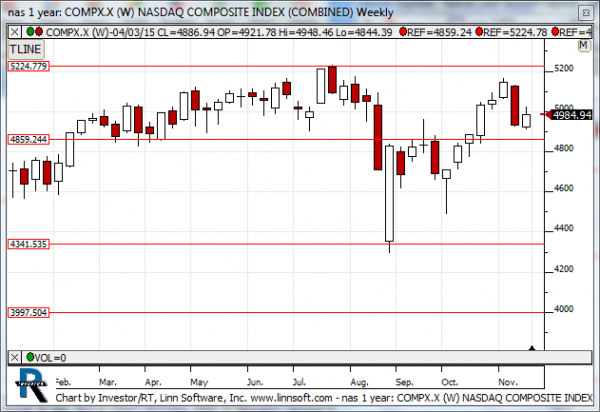
LONG Term Analysis
Our combined longer term analysis tells us that the Markets are all close to their longer term intra channel support levels again. The S&P came very close to 2128 about 10 days ago, and that level held as resistance, and the S&P along with the other markets are now very close to testing intra channel support. That is major inflection and it needs to hold or the tones will become much more bearish. If the S&P breaks 1990, for example, a 100 point decline can follow.
LONG Term Support for the NASDAQ exists at 4859
LONG Term Resistance for the NASDAQ exists at 5225