For Nov, 20 2015
(Individual Chart Analysis)
This is a no-frills analysis. It is not designed
to look good, it is designed to be effective.
Summary of the Technical Analysis for the NASDAQ
(This takes into account the near term, mid term, and longer term charts)
Expect the market to begin the day flirting with breaks of initial support. If initial support breaks expect modest declines and neutral near term patterns, but for anything serious to happen the markets would also need to break below midterm intra channel support lines again too. If that happens midterm down channels are likely to form, but those levels are not currently breaking, in fact near term up-channel support is holding too, and thus far positive tones prevail, but there is a risk. The Russell 2000 has already started to break slightly, but the other markets would need to join the Russell for the tones to begin to change. Reasonably, the markets are likely to begin the day Friday flirting with that, so flirting with sentiment changes accordingly. If initial support breaks a sentiment shift will begin, and if secondary support breaks it can turn bearish, but neither have broken yet except in the Russell.
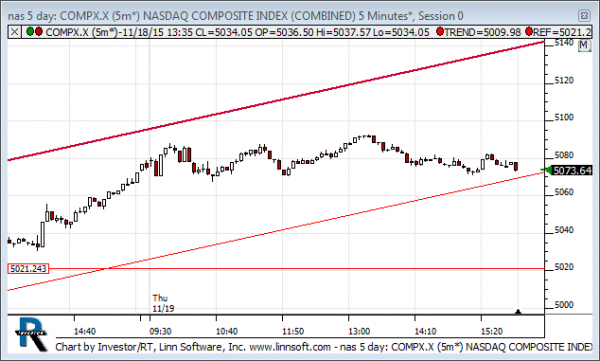
| Initial intraday trading parameters for the NASDAQ exist between5073 - 5143 |
| If 5073 breaks lower expect 5017 |
| If5143breaks higher expect 5161 |
| Otherwise expect5073 - 5143 to hold |
If 5073 remains in tact as initial support, expect the market to increase to 5143. This reflects a tight near term down channel. However, and in line with our combined analysis, if 5073 breaks lower instead expect the market to decline to 5017 before it stabilizes again.
NEAR Term Analysis
Our combined near term analysis tells us to expect the market to begin g the day threatening near term up-channel support lines. The Russell has already started to break and the other markets could follow. If they do our combined near term analysis tells us to expect modest declines and neutral channels to develop, but if the up-channel support lines hold expect a meaningful increase to higher highs and up-channel resistance instead.
NEAR Term Support for the NASDAQ exists at 5073
NEAR Term Resistance for the NASDAQ exists at 5143
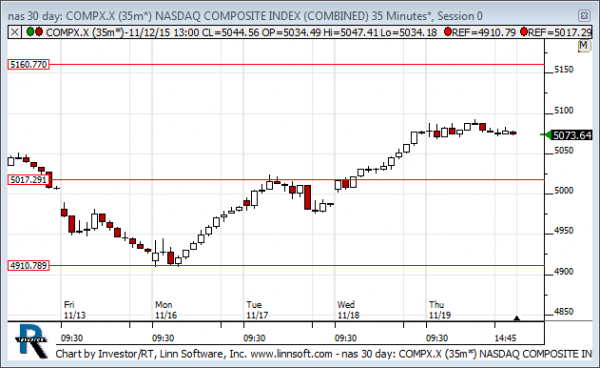
MID Term Analysis
Our combined midterm analysis tells us that the midterm intra channel support levels must remain intact for the positive tones to be sustained. Thus far they are holding, but they would need to continue to hold for that to remain true. If they break lower again midterm downward sloping trend lines could follow.
MID Term Support for the NASDAQ exists at 5017
MID Term Resistance for the NASDAQ exists at 5161
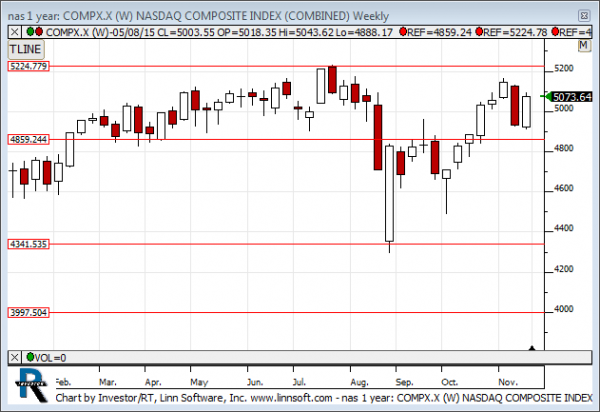
LONG Term Analysis
Our combined longer-term analysis tells us that bold green candles are developing right behind the red candles from last week and thus far that is a positive sign, but the week is not over and it would need to end this way in order for positive longer-term attributes to be maintained. Thus far, there is a positive tone from our longer term charts however.
LONG Term Support for the NASDAQ exists at 4859
LONG Term Resistance for the NASDAQ exists at 5225