For Nov, 09 2015
(Individual Chart Analysis)
This is a no-frills analysis. It is not designed
to look good, it is designed to be effective.
Summary of the Technical Analysis for the S&P 500
(This takes into account the near term, mid term, and longer term charts)
Our combined analysis tells us to expect the Market to begin the day with a bias to increase on Monday and to expect tests of resistance in the DJIA, S&P, and NASDAQ, and those are inflection. However, the Russell 2000 is braking out across the board (near term, midterm, and long term), and that's bullish for the Russell. The other markets are neutral, and that makes our combined analysis neutral, but the Russell is a clear standout right now. The key level, after everything is considered, is actually 2128 in the S&P, and it has more influence than anything else, but for now interim levels exist that should be respected too. Treat initial resistance in the S&P, DJIA, and NASDAQ as those are defined in our combined data tables as inflection and consider the ability or inability of the markets to hold resistance to be the determinate of either a retracement and a solidification of the existing neutral channels, or the development of upward sloping ones.
| Initial intraday trading parameters for the S&P 500 exist between2096 - 2115 |
| If 2096 breaks lower expect 2086 |
| If2115breaks higher expect 2128 |
| Otherwise expect2096 - 2115 to hold |
If 2096 remains in tact as initial support, expect the market to increase to 2115. This reflects a tight near term down channel. However, and in line with our combined analysis, if 2096 breaks lower instead expect the market to decline to 2086 before it stabilizes again.
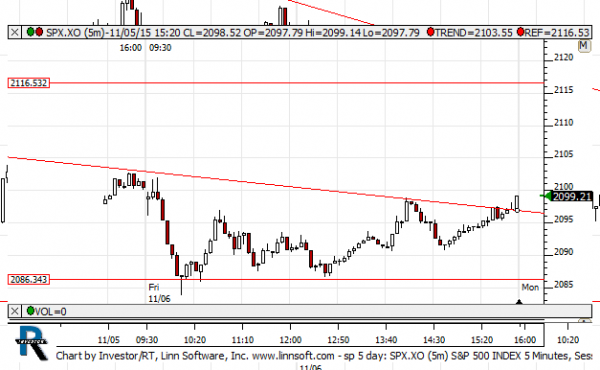
NEAR Term Analysis
Our combined near term analysis suggests that the Market begin the day with a bias to increase, and it shows us that the Russell 2000 has been strongest lately. The other markets also point to higher levels and tests of neutral resistance, but the Russell 2000 is breaking out beyond neutral near term resistance levels already. The ability or the inability of the other markets to hold resistance, however, is inflection, so monitor those accordingly.
NEAR Term Support for the S&P 500 exists at 2096
NEAR Term Resistance for the S&P 500 exists at 2116
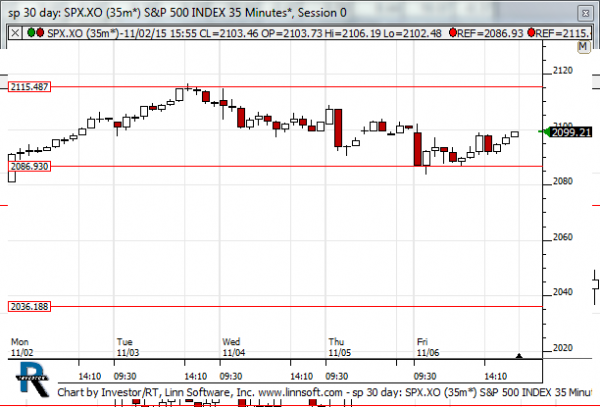
MID Term Analysis
Our combined midterm analysis tells us that the midterm channels are holding in all markets except the Russell 2000; the Russell 2000 is breaking out. There are bullish tones in the Russell as a result, with neutral tones in the other markets. Our combined midterm analysis is therefore neutral.
MID Term Support for the S&P 500 exists at 2086
MID Term Resistance for the S&P 500 exists at 2115
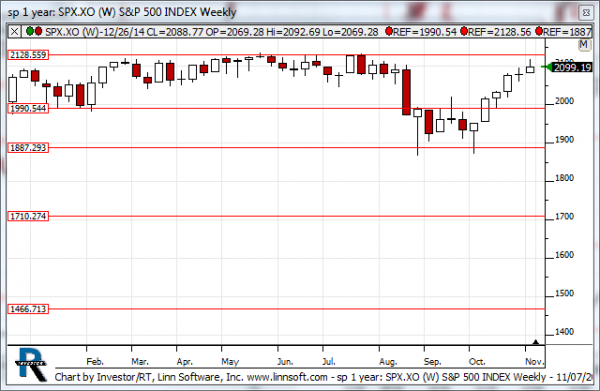
LONG Term Analysis
Our combined longer term analysis shows us that the Russell is breaking out, and that's bullish, but the most important number is 2128 in the S&P 500. This is a major level of resistance and the S&P is relatively close to it at this time. If resistance levels hold the markets are likely to fall back within these channels, but if the S&P breaks above 2128 it will be very bullish. The Russell 2000 is already positive.
LONG Term Support for the S&P 500 exists at 1887
LONG Term Resistance for the S&P 500 exists at 1990