For Nov, 12 2015
(Individual Chart Analysis)
This is a no-frills analysis. It is not designed
to look good, it is designed to be effective.
Summary of the Technical Analysis for the S&P 500
(This takes into account the near term, mid term, and longer term charts)
Our combined analysis for Thursday tells us to expect the market to begin the day with a bias to decline and it tells us to respect initial support as inflection. The midterm intra channel resistance lines, which were the former support levels that broke lower recently, remain intact as they were tested on Wednesday and if the market falls and breaks initial support, which is essentially the lows that were established on Wednesday in the Russell, momentum driven declines can follow. According to the midterm chart patterns at this time the market has considerable room to decline if these intra channel resistance levels remain intact. So far resistance is holding and therefore our combined midterm analysis offers major red flags, but in order for the continuation lower to take place initial support would need to break so that acts as our downside confirmation catalyst. If it holds the market may attempt to test midterm intra channel resistance again, but if initial support as that is defined in our combined data tables breaks lower instead we should be prepared for momentum driven declines.
| Initial intraday trading parameters for the S&P 500 exist between2070 - 2086 |
| If 2070 breaks lower expect 2036 |
| If2086breaks higher expect 2115 |
| Otherwise expect2070 - 2086 to hold |
If 2070 remains in tact as initial support, expect the market to increase to 2086. This reflects a tight near term down channel. However, and in line with our combined analysis, if 2070 breaks lower instead expect the market to decline to 2036 before it stabilizes again.
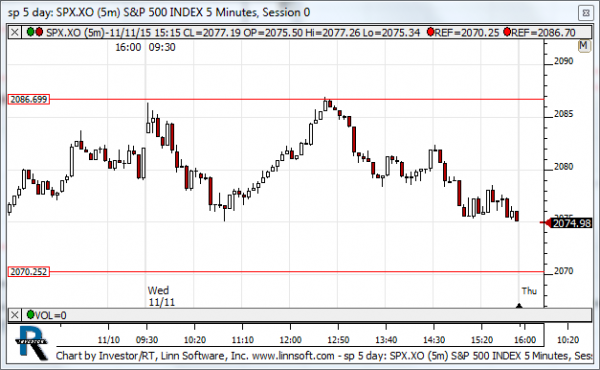
NEAR Term Analysis
Our combined near-term analysis tells us the market is likely to begin the day with a bias to decline as it opens on Thursday but the resistance lines in the S&P 500 and Dow Jones industrial average are inflection, while the support lines in the NASDAQ and the Russell 2000 are inflection in those markets instead. There is divergence between these market groups according to our combined near-term analysis, but still with a propensity to decline at the onset of trading on Thursday.
NEAR Term Support for the S&P 500 exists at 2070
NEAR Term Resistance for the S&P 500 exists at 2086
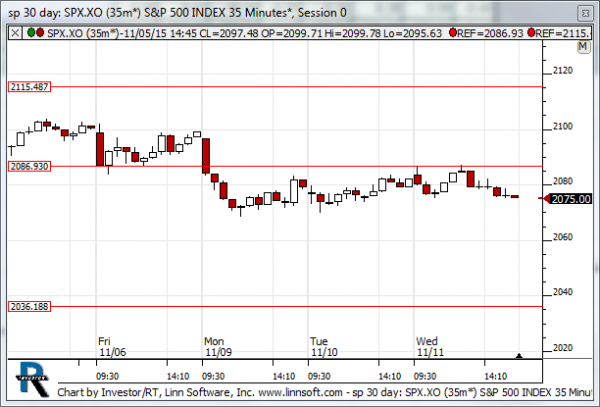
MID Term Analysis
Our combined midterm analysis tells us that the markets all attempted to reverse above their midterm intra channel resistance lines but those midterm intra channel resistance lines, which were the intra channel support lines that broke lower recently, remained intact. That continues to open the door to lower market levels and the market is capable as result of declining aggressively. Risks are high according to our combined midterm analysis at this time and that will remain true unless the markets reverse back above these neutral intra channel resistance levels.
MID Term Support for the S&P 500 exists at 2086
MID Term Resistance for the S&P 500 exists at 2115
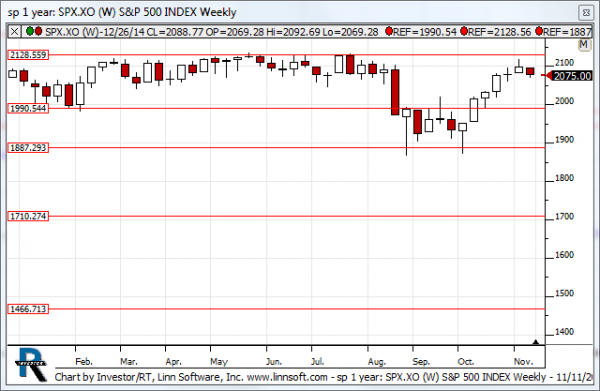
LONG Term Analysis
Our combined longer term analysis shows us that the Russell is breaking out, and that's bullish, but the most important number is 2128 in the S&P 500. This is a major level of resistance and the S&P is relatively close to it at this time. If resistance levels hold the markets are likely to fall back within these channels, but if the S&P breaks above 2128 it will be very bullish. The Russell 2000 is already positive.
LONG Term Support for the S&P 500 exists at 1887
LONG Term Resistance for the S&P 500 exists at 1990