For Nov, 13 2015
(Individual Chart Analysis)
This is a no-frills analysis. It is not designed
to look good, it is designed to be effective.
Summary of the Technical Analysis for the S&P 500
(This takes into account the near term, mid term, and longer term charts)
Our combined analysis for Friday tells us to expect the market to begin the day flirting with breaks of support, and it is midterm neutral support that is important. Steep near term down channels exist, those clearly look bearish, but if midterm support levels hold the markets can turn higher. In fact, the midterm neutral support levels would need to break to bring a bearish tone to the midterm channels. Those are neutral right now, even though the near term channels are quite bearish. Respect midterm neutral support, recognize that it is either close or being tested in all markets, and consider the ability or inability of the market to hold this level to be an important technical indicator. If it holds, brace for a snap back, but if it breaks be ready for more weakness before s nap back comes.
| Initial intraday trading parameters for the S&P 500 exist between2045 - 2056 |
| If 2045 breaks lower expect 1990 |
| If2056breaks higher expect 2070 |
| Otherwise expect2045 - 2056 to hold |
If 2045 remains in tact as initial support, expect the market to increase to 2056. This reflects a tight near term down channel. However, and in line with our combined analysis, if 2045 breaks lower instead expect the market to decline to 1990 before it stabilizes again.
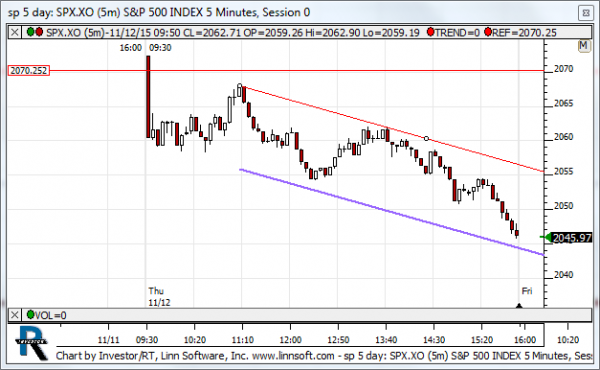
NEAR Term Analysis
our combined near term analysis tells us that the market is likely to begin the day flirting with breaks of near term support levels. If broken this will be bearish, but the near term charts are already bearish so breaks of support may not make the already steep down channels more bearish than they already are. More appropriately, resistance levels should be monitored, because if near term down channel resistance breaks higher the probability of a meaningful increase is high.
NEAR Term Support for the S&P 500 exists at 2046
NEAR Term Resistance for the S&P 500 exists at 2056
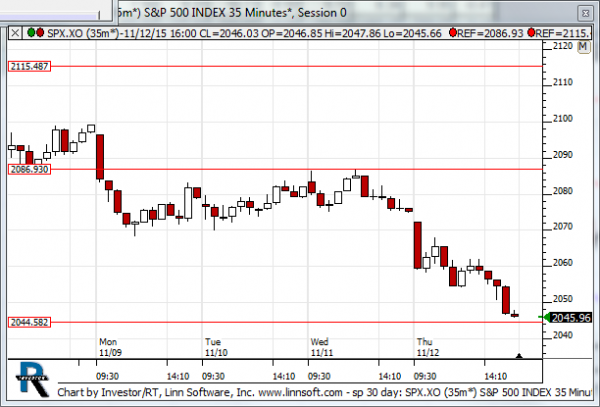
MID Term Analysis
Our combined midterm analysis tells us that midterm support levels are close if not already being tested. If the market holds support meaningful market increases are likely. Reasonably, the market does have additional room to decline before tests of support become official, but midterm neutral support is inflection according to our combined midterm analysis. If it holds expect a meaningful increase, but if it breaks lower expect a much more bearish tone to prevail.
MID Term Support for the S&P 500 exists at 2044
MID Term Resistance for the S&P 500 exists at 2086
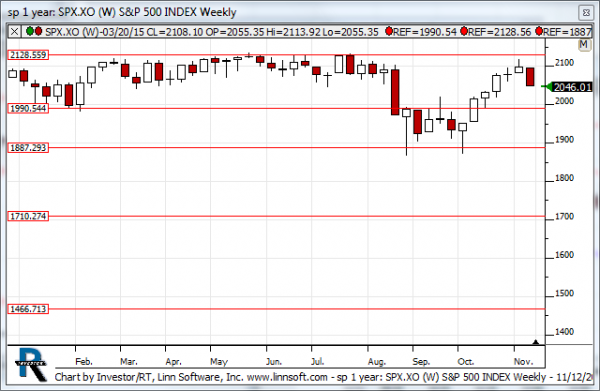
LONG Term Analysis
The S&P is pulling back after coming close to 2128, a defined level of formidable resistance that we spoke about in our heads up over the weekend. The subsequent candles are bearish, but the week is not yet over.
LONG Term Support for the S&P 500 exists at 1887
LONG Term Resistance for the S&P 500 exists at 1990