For Oct, 01 2015
(Individual Chart Analysis)
This is a no-frills analysis. It is not designed
to look good, it is designed to be effective.
Summary of the Technical Analysis for the S&P 500
(This takes into account the near term, mid term, and longer term charts)
Our combined analysis for Thursday tells us to expect the market to begin the day with a slight bias to increase but formidable resistance levels exist in the Dow Jones industrial average, NASDAQ, and Russell 2000. Those markets will need to break above their respective downward sloping midterm resistance levels in order for the markets to press higher, but the S&P 500 is already breaking its midterm downward sloping resistance line. If the other markets follow the S&P 500 and break higher as well substantial market increases can follow according to our combined analysis, but the other markets have not yet joined the S&P 500 and unless they do those midterm downward sloping channels will remain intact. That means, if the resistance lines in those other markets remains intact we should expect a lower low. Monitor downward sloping resistance in the Dow Jones industrial average, NASDAQ, and Russell 2000 accordingly.
| Initial intraday trading parameters for the S&P 500 exist between1916 - 1942 |
| If 1916 breaks lower expect 1905 |
| If1942breaks higher expect 1979 |
| Otherwise expect1916 - 1942 to hold |
If 1916 remains in tact as initial support, expect the market to increase to 1942. This reflects a tight near term down channel. However, and in line with our combined analysis, if 1916 breaks lower instead expect the market to decline to 1905 before it stabilizes again.
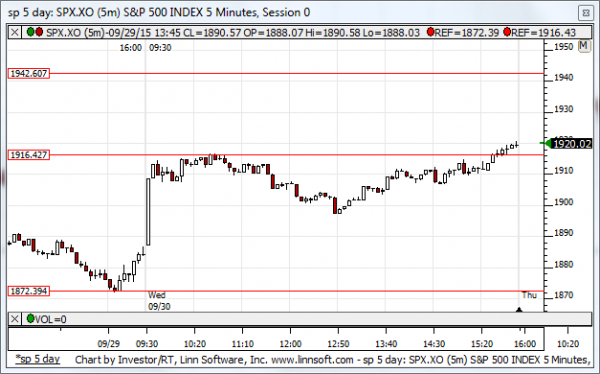
NEAR Term Analysis
Our combined near-term analysis tells us that the market is likely to begin the day with a bias to increase and if recently broken resistance levels remain intact as converted support the market should progress higher towards the highest levels of neutral near term resistance accordingly. Treat converted support in the S&P 500 as inflection and if this remains intact as converted support expect a progression higher from all markets, but if it breaks lower instead expect neutral near-term patterns and another test of the lowest neutral support levels instead.
NEAR Term Support for the S&P 500 exists at 1872
NEAR Term Resistance for the S&P 500 exists at 1916
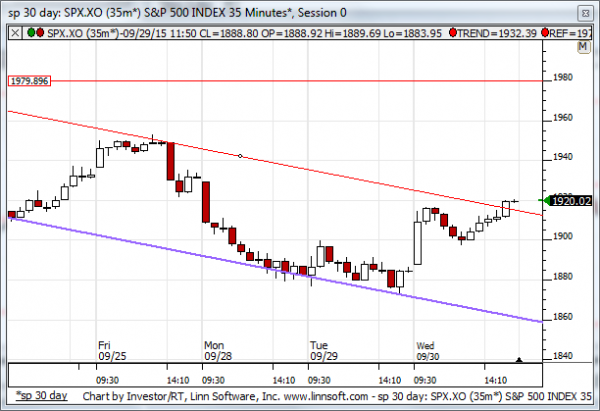
MID Term Analysis
Our combined midterm analysis tells us that the S&P 500 is starting to break above its down channel resistance line but the other markets are not yet doing that. The other markets are pressing midterm downward sloping resistance lines, but only the S&P 500 has begun to break resistance thus far. We should respect midterm downward sloping resistance in the other markets as formidable resistance and if those levels remain intact we should expect the markets to turn down again and make a lower low, but if midterm downward sloping resistance breaks higher in the other markets like it has already in the S&P 500 a much more aggressive upward move in the market is likely to follow instead.
MID Term Support for the S&P 500 exists at 1860
MID Term Resistance for the S&P 500 exists at 1905
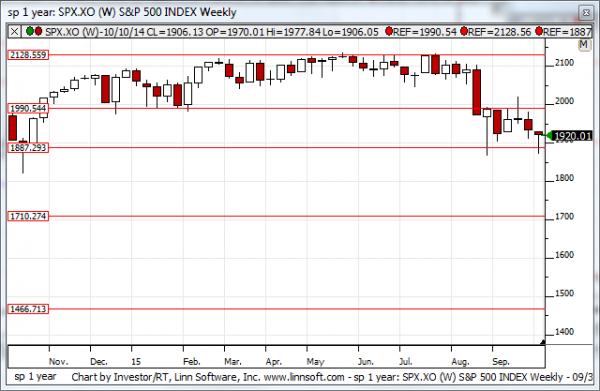
LONG Term Analysis
Our combined longer term analysis for the NASDAQ is offering a bearish indicator; a DOJI pattern followed by an engulfing red candle is a red flag. The others markets are not so bearish. In fact the DJIA suggests that longer term support was tested and that is a positive indicator. As a result our combined longer term analysis continues to lack cohesion and the markets are not in parity on a longer term basis.
LONG Term Support for the S&P 500 exists at 1887
LONG Term Resistance for the S&P 500 exists at 1990