For Sep, 27 2018
(Individual Chart Analysis)
This is a no-frills analysis. It is not designed
to look good, it is designed to be effective.
Summary of the Technical Analysis for the DOW
(This takes into account the near term, mid term, and longer term charts)
Our combined analysis for Thursday tells us to expect the Markets to begin the day flirting with initial support. If initial support holds we should expect the Markets to bounce back to lower highs, defined as initial resistance in our combined data tables. However, if these same support levels break we should expect a modest additional decline to midterm neutral support in the SPX and DOW. This would equate to about 0.5%. Treat support as inflection and consider the markets ability or inability to hold support to be a determining factor in market direction.
| Initial intraday trading parameters for the DOW exist between26310 - 26460 |
| If 26310 breaks lower expect 26204 |
| If26460breaks higher expect 26637 |
| Otherwise expect26310 - 26460 to hold |
If 26310 remains in tact as initial support, expect the market to increase to 26460. This reflects a tight near term down channel. However, and in line with our combined analysis, if 26310 breaks lower instead expect the market to decline to 26204 before it stabilizes again.
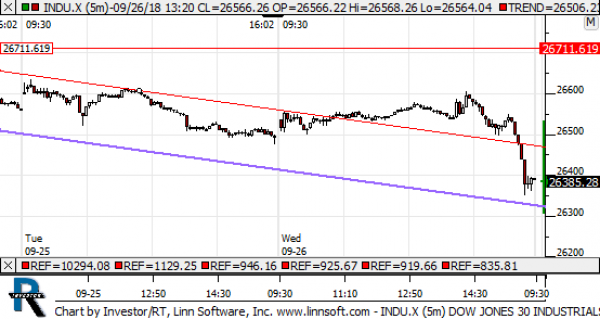
NEAR Term Analysis
Our combined near term analysis tells us tat the Markets are likely to begin the day flirting with breaks of initial support. Treat support as inflection, and if it holds expect a bounce back towards resistance, but if near term support levels begin o break the markets can fall more aggressively again before stabilizing.
NEAR Term Support for the DOW exists at 26310
NEAR Term Resistance for the DOW exists at 26460
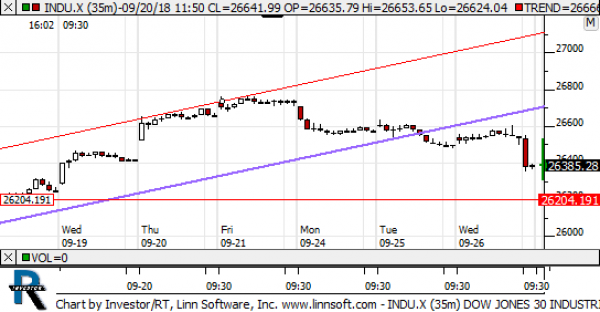
MID Term Analysis
Our combined midterm analysis tells us that the SPX and DOW are breaking below their midterm up-channel support levels, and that opens the door for declines to neutral support there. Declines are also suggested by the midterm chart of the NDX, but it is in an up channel still. The Russell is breaking support, so there are differences, but the one common factor is that all markets are suggesting declines of about 0.5%.
MID Term Support for the DOW exists at 26204
MID Term Resistance for the DOW exists at 26700
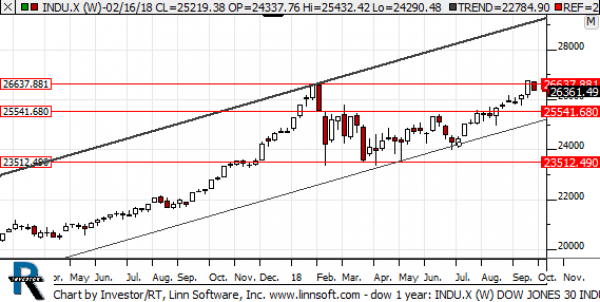
LONG Term Analysis
Our combined longer term analysis tells us that the Dow Jones industrial average is breaking back below 26637. This reversal is so far a bearish indicator, but this week is far from over and in order for an official break to happen the Dow Jones industrial average would need to end the week below 26637 as well. Red flags have surfaced, they have been actionable, and if these breaks hold it will be bearish.
LONG Term Support for the DOW exists at 25541
LONG Term Resistance for the DOW exists at 26637