|
Our trading
strategies focus on discipline and risk control.
We offer automated
and correlated trading strategies and real time
trading reports on individual stocks.
We consider our
strategies to be similar to the Tortoise in the
race with the Hare. We do not design them
for home runs, but rather to take advantage of
small gains regularly; they incorporate strict
risk controls. We are satisfied taking
small gains all the time so long as we remain in
control of our risk at all times.
There's no reason
to subject ourselves to excessive risk, so we
don't recommend it. The end result, we are
also always in the game, and that is the name of
the game.
Topics:
-
Individual
Stock Reports
-
Intelligent
Alerts Viewer
-
Automated
Trading Program
-
Give it a Try
Individual Stock
Reports
We offer real time
trading reports on 1300 different Stocks.
Trading plans are
included for day trades, swing trades, and long
term trades.
These reports are
unbiased. Each report includes trading
plans for longs and for shorts. The
reports do not tell you to buy or to short, but
if you know how you want to trade the stock
before you review the report, our reports will
tell you exactly where to enter the trade, where
your price target should be, and where your stop
loss should be placed.
For example, if you
knew that you wanted to buy AAPL, you could use
our AAPL report to help you determine exactly
where you should buy the stock.
These reports are
an integral part of our Intelligent Alerts Viewer (read
below).
We also use them
for other purposes:
Here's an example
of our reports:
|
Example
from 9.17.07
BRCM
(BROADCOM CORP CL A)
Recently trading at: 34.85
September 17, 2007, 9:43 pm
ET
Refresh to update stock values
|
Trading Plans
for BRCM |
|
Day Trading Plan
|
|
Swing Trading
Plan |
|
Long Term
Trading Plan
|
|
|
|
Technical Summary |
| |
Near Term
|
Mid Term
|
Long Term
|
|
Directional Bias
|
Neutral
|
Strong |
Neutral |
|
Parameter 1 |
34.81
|
33.43 |
22.88 |
|
Parameter 2 |
35.49
|
35.59
|
34.18 |
|
Parameter 3 |
36.23
|
37.75
|
46.30
|
|
Parameter 4 |
|
|
|
If you were to click on one of the Trading Plan links above you would
reeive trading plans for that term.
Here's an example of the day trading
plan for BRCM for 9.17.07:
 |
|
Day Trading
Plans for BRCM |
September 17,
2007, 9:45 pm.
|
The slope of the near
term analysis for BRCM
is strong, the slope of
the mid term analysis
for BRCM is neutral, and
the slope of the longer
term analysis for BRCM
is neutral. When
combined with the
Technical Summary for
BRCM, this directional
analysis helps us
understand how we should
be trading BRCM. The
following trading plans
were derived using this
data and they tell you
how to trade the stock.
However, they do not
tell you whether you
should buy or short the
stock. You need to know
that before you trade.
If you do not know
already, our Market
analysis will help you
make long or short
decisions.
| Technical
Summary: ,
22.88, 33.43,
34.18, 34.81,
34.85 ,
35.59, 36.23,
37.75, 46.30,
Where 34.85 =
the recent price
|
(Long) Resistance Plan:
Buy over 35.59,
target 36.23, Stop Loss
@ 35.38
If 35.59 begins to break
higher, the technical
summary data will
suggest a buy of BRCM
over 35.59, with an
upside target of 36.23.
The data also tells us
to set a stop loss @
35.38 in case the stock
turns against us. 35.59
is the first level of
resistance above 34.85 ,
and by rule, any break
above resistance is a
buy signal. In this
case, resistance 35.59
would be breaking
higher, so a buy signal
would exist.
(Long) Support Plan:
Buy near 34.81,
target 35.59, Stop Loss
@ 34.6
The technical summary
data tells us to buy
BRCM near 34.81 with an
upside target of 35.59.
This data also tells us
to set a stop loss @
34.6 to protect against
excessive loss in case
the stock begins to move
against the trade. 34.81
is the first level of
support below 34.85 ,
and by rule, any test of
support is a buy signal.
In this case, support
34.81 would be being
tested, so a buy signal
would exist.
(Short) Resistance Plan:
Short near 35.59,
target 34.81, Stop Loss
@ 35.8
The technical summary
data is suggesting a
short of BRCM if it
breaks below 35.59 with
a downside target of
34.81. We should have a
stop loss in place at
35.8 though in case the
stock begins to work
against the trade. By
rule, any break below
support is a short
signal. In this case, if
resistance 35.59 is
breaking lower, a short
signal would exist.
(Short) Support Plan:
Short under 34.81,
target 34.18, Stop Loss
@ 35.02
The technical summary
data is suggesting a
short of BRCM if it
breaks below 34.81 with
a downside target of
34.18. we should also
have a stop loss in
place at 35.02 according
to the data. 34.81 is
first level of support
below 34.85 , and by
rule, any break below
support is a short
signal. In this case, if
support 34.81 is
breaking lower, a short
signal would exist.
Please Note: The Trading Plans listed above are based on real
time stock prices.
However, as time goes by
prices change, so please
refresh your request if
you delay your
decisions, because as
the Market moves, these
Trading Plans may
change. They are dynamic
and they change as the
market changes so they
are only valid at or
near the time you
request them. |
|
|
We use our
reports for our Focus List...
Focus List.
Our Focus List is made up of about 100 Stocks
which we have pre-qualified as good trading
candidates. These are not the hot stocks
of the day, rather they are the stocks which
tend to move with the market when the market
moves. They have high levels of liquidity,
so it is easy to get in and out of them; they
are more stable than story stocks. We
provide trading reports for each member of our
Focus List, just like we do all the other stocks
we follow.
We use our reports
for our Stock Filters...
Stock Filters.
We offer filters in association with our Focus
List which will allow you to identify, at any
given time, day trading, swing trading, and long
term trading opportunities based on the trading
reports we have created for our Focus List.
Here's an example
of our filters (we have day, swing, and long
term filters):
| Example from 9.17.07
Filters
|
Day Trading Suggestions
|
Short Day Trading Ideas Near
Resistance
| MMM |
Short under 88.99, target
88.58, Stop Loss @ 89.2
(Resistance Plan)
|
| LLTC |
Short under 34.49, target
34.11, Stop Loss @ 34.7
(Resistance Plan)
|
| FDX |
Short under 108.11, target
106.87, Stop Loss @ 108.32
(Support Plan)
|
| MXIM |
Short under 29.03, target
28.53, Stop Loss @ 29.24
(Resistance Plan)
|
| CAT |
Short under 73.82, target
72.65, Stop Loss @ 74.03
(Resistance Plan)
|
The
entire list contains 30 stocks orders
from nearest to furthest from their
respective parameters. In this
case the list is orders from nearest to
furthest away from resistance.
|
We use our reports
for our Featured Stock Recommendation...
Featured Stock
of the Day. We use our trading reports
in conjunction with the filters mentioned above
and our Market Analysis to offer a single
trading recommendation every day. The
stock we choose is called our Featured Stock of
the Day. This stock is designed to work
with the Market Analysis we provide for the
trading session in question. For example,
if we expect the market to test resistance and
turn lower, we filter the Focus List for stocks
likely to test resistance at the same time the
Market does, and we would select a stock to
short from that list; the stock we select would
be our Featured Stock of the Day.
Here's an example
of a Featured Stock Recommendation:
| Example from 9.17.07
United Technologies (UTX). Short
UTX between 76.11 and 76.06. Target
75.01. If you are triggered set a stop
loss at 76.32 to protect your position.
In addition, if the stock triggers as
indicated above and then moves into the
money by $0.35 set a $0.10 trailing
profit stop to secure a gain from the
trade. Specifically, if the stock gets
to 75.76 set a trailing $0.10 profit
stop at 75.86 and let the protectionist
trailing profit stop ride as the stock
moves. Using this approach will allow
you to get more out of the trade and it
will force you to protect your position
too. If you are stopped you should be
willing to re-enter the trade. Limit
your # of trades to 3 though. Don't
trade it more than 3 times with both
stops and profits included. No matter
what, end the day in cash. |
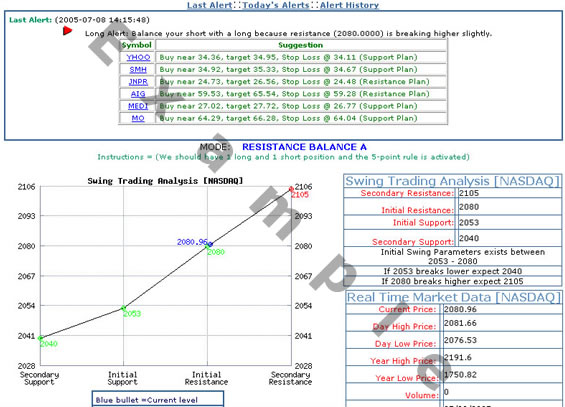
Intelligent
Alerts Viewers:
We have created an
Alerts Viewer which is intelligent, which knows
where the support and resistance levels that we have identified
for the Market exist,
and which automatically alert you (with a
series of beeps) to any test of support or
resistance when it occurs.
The Alerts Viewer
acts as a resource to traders who want alerts
when tests of support or resistance levels
happen, but who might not be able or willing to
sit back and watch the Market tick by tick.
These alerts
include correlated trading recommendations as
well. When an alert is fired the program
filters our Focus List for stocks which are
trading with the Market, so you have a high
probability of identifying stocks which are
going with the flow.
If, for example,
the Market tests a support level an alert fires
which includes 5 stocks which are trading at
their respective support levels at the same
time. Therefore, the trading
recommendations offered in the alert correlate
with the market based on the Timing parameters
that we provide.
All you need to do
is open the page, minimize it on your computer,
and make sure your sound is on. The
web-based program will do the rest. Wait
for an alert, pick one of the stocks on the
list, and execute your trade.
Find an example
here, then review the terms below:
Automated Trading Program:
This is the first
completely automated trading program on the
market.
This is also known
as our ATAP Program. The explanation for
this program is included in a section of its
own. Read the complete description of the
ATAP Program by clicking the
ATAP link on the left side of this page.
Give it a try:
 |
|
Free 10
Day Trial - Platinum Membership
Sign Up Now
You can cancel at any time and won't be charged
All of our services are
included in the Free Trial.
Instructions:
- Click the Sign Up Link below to start your Free Trial
- Record your username and password.
- Use the Platinum Login to enter the Clubsite.
- Your Free Trial lasts for 10 Calendar Days
- The service is $299 per month after 10 Days.
|
|
|