AI-GENERATED SGNALS
MACRO, TRADING PLANS, STRATEGES & MODELS


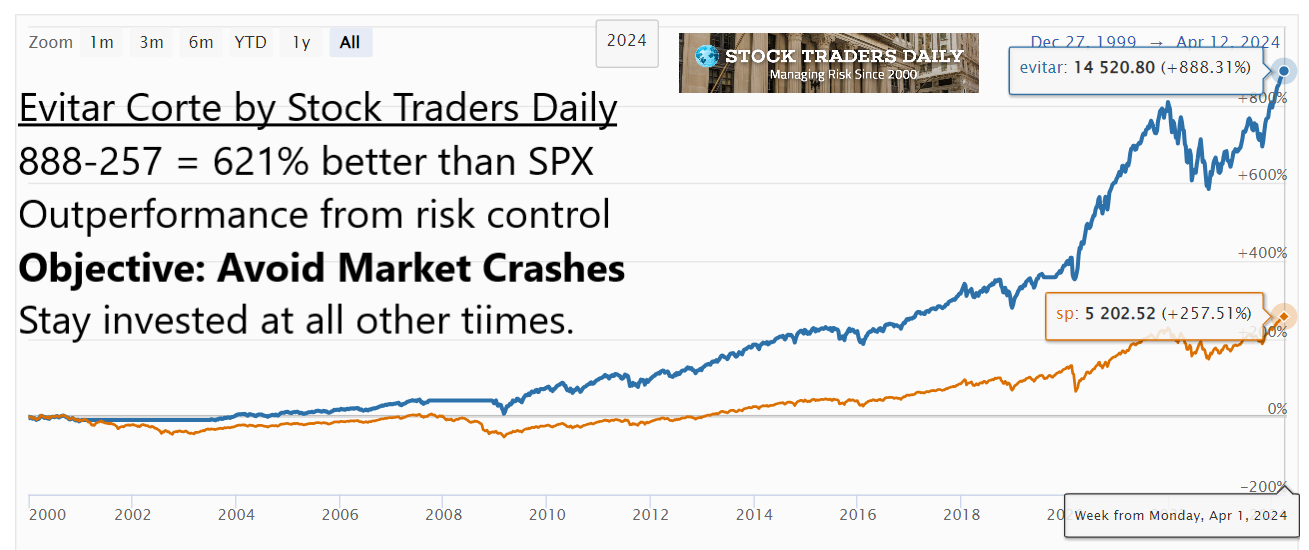
Stock Traders Daily was established on January 12, 2000, the peak of the Internet Bubble, and it had to manage risk to survive. After beginning with a focus on active strategies, Stock Traders Daily transformed to help long term and institutional investors manage risk efficiently. We share what we think is the most efficient method of managing risk with our clients. It has helped us thrive during the Internet Debacle, Credit Crisis, the Corona Crash, and the up-periods in between. Our defensive mindset does not sacrifice performance. Performance is a Natural Byproduct of Risk Control!

Protected
Protected
Protected
Protected
Protected
Protected
Protected
Protected
Protected
Protected
Protected
Protected
Protected
Protected
Protected
Our Evitar Corte Model has materially outperformed the S&P 500, and it comes from playing defense.
| As of 07.13.23 | 1 year | 3 year | 5 year | 10 year | Inception |
| Evitar Corte | 17.11% | 40.42% | 95.61% | 222.54% | 741.23% |
| SP 500 | 17.10% | 40.41% | 59.82% | 163.56% | 204.30% |
| Diff-scroll | 536.93% |
Stock Traders Daily offers macro and market analysis, strategies and models, and timing tools.


