The Month of May
For those of you who have been following my MarketWatch columns, I suggested we short In January, buy in February, stay long in March but avoid being tied to the Market, and to prepare for higher interest rates in April. We have stayed long since February, but as of Tuesday, April 27, 2010, we proactively transitioned to the short side of the Market.
On April 26, 2010, I suggested, though my nightly newsletter, that we sell any and all long-term buy and hold investments, and the UGL and DIG positions that we had been holding in our Position trading Portfolio. I saw red flags, and on Tuesday, those red flags may have been confirmed.
In the illustrations below, I show the process that we use to define reversal confirmations in the Market. The technique incorporates both technical analysis and Fibonacci calculations to define longer-term peaks and valleys in the market. Specifically, 2537 in the NASDAQ may have been a peak that will last for a while.
This reversal confirmation process has three integral steps. After identifying longer term Fibonacci Based resistance and Technical resistance levels, we look for the following to happen:
1. We look for a break above Fibonacci-based resistance
2. We look for a test of Technical Resistance
3. We look for a reversal back below the Fibonacci resistance level again.
This three-step process has worked wonderfully at determining longer-term inflection levels in the past, and we have used it to define major turning points numerous times.
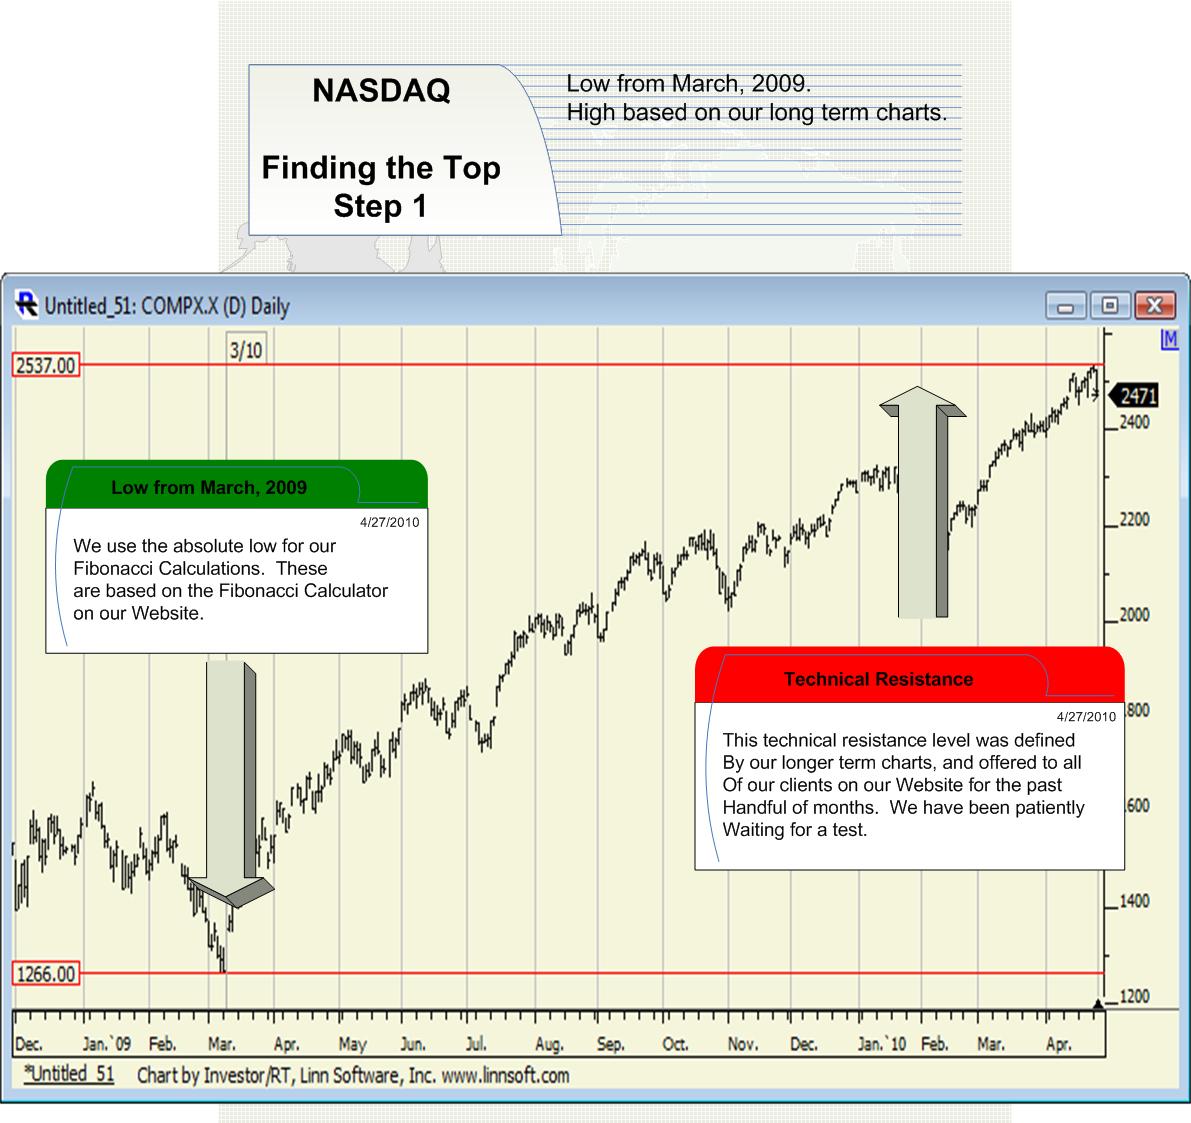
Step 1:
Identify the ultimate low in the NASDAQ. It was 1266 from March 2009. Then, use technical charts to identify longer-term resistance. Based on our review, that was 2537.
Step 2:
Input the NASDAQ low from March 2009, 1266, into the low Box of the Fibonacci Calculator on our website. Then, look for a value on the right side, close to the resistance level defined by our technical charts. Review the T-11 value below.
|
Low = 1266 |
The input |
High = 0 |
|
Supports from High |
Tiers |
Resistances from Low |
|
0.00 |
T1 |
1314.11 |
|
0.00 |
T2 |
1344.49 |
|
0.00 |
T3 |
1471.09 |
|
0.00 |
T4 |
1597.69 |
|
0.00 |
T5 |
1724.29 |
|
0.00 |
T6 |
1850.89 |
|
0.00 |
T7 |
1977.49 |
|
0.00 |
T8 |
2104.09 |
|
0.00 |
T9 |
2230.69 |
|
0.00 |
T10 |
2357.29 |
|
0.00 |
T11 |
2483.89 |
|
0.00 |
T12 |
2610.49 |
|
0.00 |
T13 |
2737.09 |
Step 3:
Watch for a break above 2483, a test of 2537, and a reversal back below 2483 again.
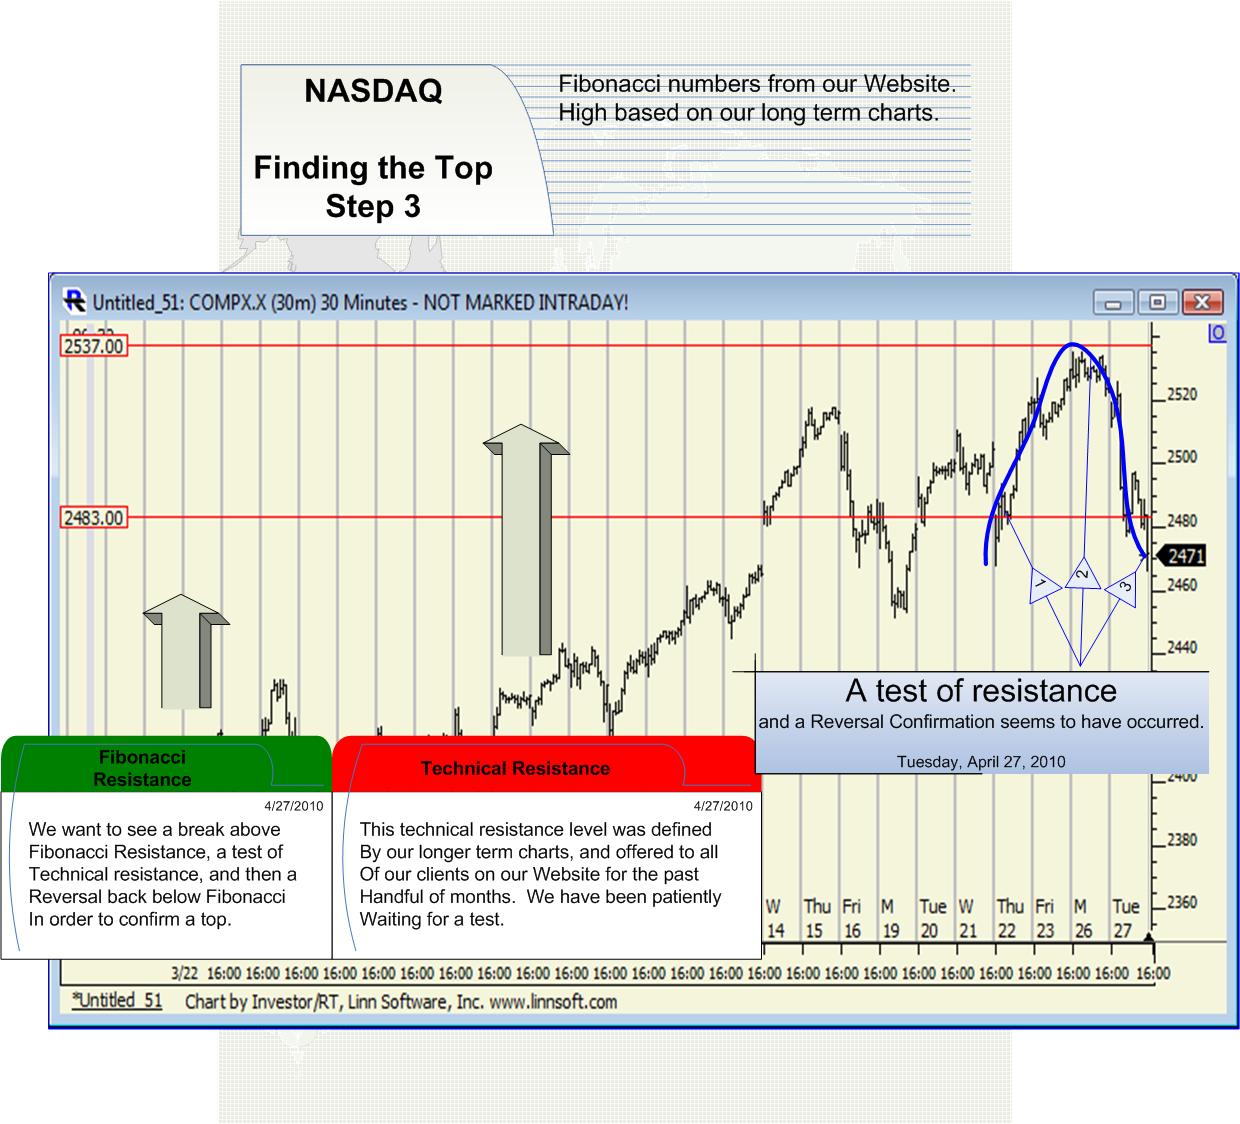
Confirmation:
On Tuesday, April 27, 2010, the market satisfied the 3-step process required for a confirmation. First, it broke above T-11, then it tested longer-term resistance, and then it reversed down again. As a result, a confirmation has occurred, and the risk of a sustained move lower is now high.
Specifically, based on a number of factors in addition to this, I expect the Market to decline in the month of May. “Sell in May and go away” is not the plan however. Instead, we have already shorted the Market in April. If the Market does fall, we will profit from it, and not sit idle. Then, if it bottoms again, we will buy it again too. I outlined this process in January and February.
My 2010 expectation is to see a back and forth pattern for the first half of the year, or so. Then I expect weakness, and sustained declines. There may still be one more nice bounce in store after these immediate declines subside, but eventually the Market is going to decline substantially once more.
I have defined this many times already using the Investment Rate, which in my opinion is the most accurate leading longer term stock market and economic indicator ever developed. It tells us that the Market is in the third major down period in US History. This is like the Great Depression and the Stagflation period of the 1970s. If you are not proactive, you will not be able to buy the dips, you will not make money, and you will be handcuffed to your investments instead.
We are proactive, and I encourage everyone to be. Consider the Stagflation period of the 1970s. If you were proactive you could have made 50% up and down a handful of times, but if you were a buy and hold investor, it was awful. In my opinion, we have just seen a top, and that means an opportunity to make money. The only question is, will the third major down period in US History get serious again right away, or will there be one more bounce?
A better question might be, is it prudent to put your wealth on the line while you make up your mind? My opinion is, sell all of your longer term positions near this top, adopt a proactive approach to the Market, begin to make money up and down, and never look back. The traditional ways of the Market are dead for a while. The title of my Book is, “Buy and Hold is Dead.” That is going to be true for the next handful of years at least.
Our complete set of our indicators including a copy of The Investment Rate can be found on our website. http://www.stocktradersdaily.com/about/index.html