×

30-Day Trial

Ringcentral (RNG) EPS Analysis

Chart

Scroll to view

The pivot points are available 24/7 to our members. Please register or login, goto the My Stocks Tab, add your stocks, and you'll get all the plans for all the stocks on your list with one click thereafter. We have made it easy for you.

Register

Backtesting RNG:

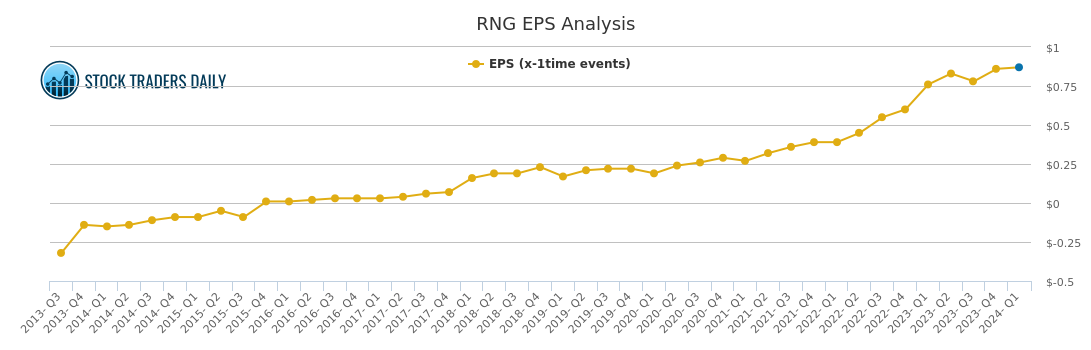
Accurate! See how accurate our pivot points for RNG are by applying the simple rules of T/A (e.g., buy near support – target resistance)
to the past RNG articles we have published. These include rules-based trading plans for RNG.

We publish public articles on most stocks once every 10-days.

Of course, we update our data in real time for Members, but you can still use the pubic data for evaluation. Do the backtesting by opening a
past article, review the trading plans in that article, then open a graph of RNG and see how the plans would have done.

Or, the easier way is to become a member and watch it live (pay attention). You’ll like what you see. Our SPY and QQQ pivots are great.
Use the trial link on this page to sign up, or click a menu item to login.

What is EPS (Earnings per Share)?

The EPS for Ringcentral (RNG) helps us define growth rates over time.

EPS stands for Earnings Per Share, and our method of evaluating EPS purposefully includes EPS results from the past twelve months. This is also known as a Trailing Twelve Month (TTM) observation, and it is used to smooth seasonal EPS skews.

The EPS changes over time represent the growth of the company, after all expenses. This data can define a company’s ability to bring sales to the bottom line, and ultimately set the stage for fair valuation analysis as well.

Often, the EPS offered by a company further demonstrates a company’s ability to reward shareholders with dividends, increased cash per share, shareholder buybacks, acquisitions, and expansion. The general rule of thumb is that the better the growth rate in EPS, the more vibrant the company.

However, most companies experience ebbs and flows in EPS growth over time, so we encourage everyone to look at the longer-term trends, and if there are current divergences to evaluate the causality in an acute fashion before reaching conclusions. Temporary declines to EPS could be the result of a one-time event, or part of the company’s growth plans, and may not be net negative.

Here is how EPS is calculated:

EPS = Net Earnings /Shares Outstanding. Earnings per share is calculated by dividing the income attributable to common shareholders by the total number of shares outstanding for the period in question. .

Our Specialized Tools

invest-rate

Protection from Market Crashes: We help investors do this with our Evitar Corte Model. It identified every crash since 2000, in advance.

Evitar Corte

Risk-control

The IR is a measure of NATURAL LIQUIDITY. The IR identified the bookends of every long term stock market cycle since 1900.

The Investment Rate (IR)

automated-trading

With a macro foundation (broad analysis), we offer actionable investment strategies that allow clients to make money in any market environment.

Investment Approach