After reading this prelude, skip to the bottom-timeline and listen to the short BNN video from June 17, 2011. That video sums up what we do quite nicely. After you do that, then take a trial or register for Platinum.
Stock Traders Daily has been offering proactive trading strategies to our clients through the internet since January 12, 2000, arguably longer than any of our peers. We have withstood the Internet Debacle, the Great Recession, and we are prepared for what lies ahead too. We have watched firms come and go, investors too, but when they fell it was always for the same reason, and we have developed our business in such a way as to avoid that mistake.
At some point those that we saw fail stopped adhering to risk controls, and material losses followed. That told us that if we maintain control of our risk at all times, we’d be less likely to encounter the same problems as those that we saw fail.


Risk control started partly as a business decision, but it has evolved into our Mantra. Stock Traders Daily has developed strategies that can work in both up and down markets, macroeconomic analysis that measures the rate of change in the amount of new money available to be invested into the economy every year so we can assess asset demand into the future, and other tools that help investors navigate markets, but none of that mattered during stimulus.
Our risk controlled strategies and models worked during stimulus, as they should, but because there was a deflated interest in risk control at the time, our stuff was unpopular. In the good times the average investor forgets about risk controls, but they never should. Eventually the market is going to encounter problems, and we should be in strategies that can automatically adapt.
“It is what you do when you are wrong that defines you.” Thomas H. Kee Jr.
This is the approach taken by Stock Traders Daily from its inception, through the Internet Debacle, Credit Crisis, Corona Crash, and the up-periods in between, including stimulus. Below are some fun facts about the evolution of Stock Traders Daily:
Our Research can now be found on these institutional venues:
- Reuters
- Factset
- Bloomberg
- Refinitiv
- Zacks
- IB
Our Biggest Readers are:
- Blackrock
- Citadel
- Two Sigma
- Invictus
- Renaissance Tech
How we got started
2000-2002
Stock Traders Daily was founded 1.12.00. It had to manage risk at the peak of the Internet Bubble; that was required to survive back then. The Trading results were approximately +250% in 2000, and about 150% in 2001 and 2002. Note (SEC Reviewed these with no contest).
2002 - Bottom Identified.
In 2002 the Investment Rate (IR) Model helped identify a maor market bottom within 5 SPX points. The bottom was in October, but the call was made months before that, so everyone had plenty of time to prepare in advance.
2002 - The IR told us the peak would be 2007
IN 2002 the Investment Rate Model defined Dec 2007 as the next peak in the market, based on The Natural Lqiuidity Levels offered by the IR
Bottle of Dom on the CEO's Desk - MarketWatch
Thomas H. Kee Jr. put a bottle of Dom on the desk of the CEO of MarketWatch in late 2007, told him the market was going to crash, and agreed to come back and drink it after the crash happened. In 2008 the market crashed. That jump started our relationship with MarketWatch, and we have been close ever since.
The Most accurate leading stock market and economic indicator.
The Investment Rate was the most accurate leading longer term stock market and economic indicator in history at that time; it was the sole determinate of new asset demand prior to stimulus. The Investment Rate had accurately pinpointed longer term peaks and valleys in the market by analyzing liquidity, and it pinpointed this one 5 years in advance.
Our Evitar Corte Model supported the IR in 2007 too.
The Evitar Corte Model, which uses the FOMC to determine when market crash risks are high, was also supporting the findings of the Investment Rate. That was meaningful.
Stock Traders Daily began developing additional strategies.
Strategy Highlights
Evitar Corte
+647% vs 161% for SP 500 since Jan 2000, by avoiding market crashes.
CORE Portfolio Strategy
Protected from corona crash, is 17% better than S&P 500 YTD (as of Dec 2022). It is a slow but steady strategy designed for lower volatility while still getting decent returns. In CASH often, and that helps investors sleep well at night.
Strategic Plan Strategy
This Strategy’s average monthly return is 1.35% per month. It trades in clusters, around long term pivots.
Stock of the Week strategy
+424% since December 2007, vs 155% for SPX. This strategy selects one stock per week, and has integrated risk controls.
Additional Fun Facts
Our Fibonacci Calculator
may have had the best trading call in history? The market surged minutes after our video was published, it turned out to be the biggest 1-day reversal in the history of the DJIA, and our Fibonacci Calculator identified the turning point in advance. On a similar note, our Fibonacci Calculator captured 800 pts from SPX over 1.5 months while the SPX floundered. Videos are available for subscribers.
Trend Tracker
Automated Trading: Trend Tracker automates our Day Trading and Lock and Walk strategies. It requires windows and connects to Interactive Brokers.
Institutional Research
Institutional Research provided to Reuters, Factset, Bloomberg, Refinitiv, Zachs, and Interactive Brokers.
62,000 RIAs
62,000 RIAs and Family offices read us every quarter.
Biggest Readers
Biggest Readers are Blackrock, Citadel, Two Sigma, Invictus, Renaissance Tech. These are some of the biggest players on the street.
About $2.8 billion
About $2.8 billion follows Stock Traders Daily directly. This is a rough estimate because we do not know all of our clients well enough to identify exact AUM.
Our Global Liquidity Report
Our Global Liquidity Report for 2022 identified all the volatility in 2022 in advance. It was published in Dec 2021. The 2023 version is available as of Dec. 2022.
Timeline
-
1999
Thomas H. Kee Jr. (THK) was a broker for Morgan Stanley in 1999. He was actively buying and shorting Internet stocks, and charging clients hundreds of dollars for every trade. Online Trading had just started, and the fees that he was charging for trading seemed outrageous in comparison. Those high commission rates also impeded some options for managing risk. That was the first sign that something needed to change.
The second reason was the unwritten law. The unwritten law at big brokerage firms is, you cannot short anything the firm has a strong buy rating on. At the end of 1999, Morgan Stanley, and almost all other big brokerage firms, had strong buy ratings on almost every Internet Stock. In hindsight, we all know that was a mistake, but THK didn’t abide by that unwritten law. As 1999 neared an end, THK began shorting them more and more. Eventually, that came to a head, and THK left Morgan Stanley.
On January 2, 2000, THK began Stock Traders Daily. Our history since then is outlined below.
-
2000 +250%*
-
2001 +150%*
-
2002 +150%*
*These rounded results were reviewed by the SEC without contest. They were generated from proactive trading recommendations and correlated strategies, not unlike the ones we use today.
-
-
February 2002 - Will an improving Economy be Enough?
In February 2002 the Investment Rate was developed. This identified the rate of change in the amount of natural new asset demand in the United States, and that prompted a report called “Will an Improving Economy be Enough?”
In correlation, Stock Traders Daily identified what it believed would be the bottom in the S&P 500, and suggested that subscribers engage a Buy and Hold Strategy when support was tested. This was the first official issuance of The Investment Rate as a timing tool, and it was telling us to look for the bottom, because a sharp turn higher could follow.
In 2002 the Investment Rate told us that the Market would head higher for a while, after support was tested, and our technicals were used to identify support. Using our prowess from active strategies, we identified support in the S&P 500 within 3.5 points in February 2002. The interesting thing is that support was not tested until many months afterwards.
-
October 2002 - Buy and Hold Strategies + The Upcoming Sell Signals
The Market came within 3.5 points of stated support in October 2002 and turned higher. A Buy and Hold phase had begun, and it had an upside target. Our upside target was based on timing provided by The Investment Rate. In 2002, it told us that Dec. 2007 would be the peak in the Market. It was.
-
September 2006 - A warning was issued.
In a report titled "Top of the Market to you!" subscribers were warned that 2007 would be the peak in the Market. They were advised to begin to consider liquidating longer term investments. That included Real Estate. This was an advanced warning, so everyone could get ahead of the curve.
Read the Press Release -
2007 CNBC Interview - "This is the Top" - Dow 13,760
Proactive Trading Strategies Ruled.
-
Seeking Alpha - BAC buys Countrywide - The Worst Decision of 2008
Dow 11842. Go to cash - sell stocks, real estate, and businesses
-
Short oil and wait for the buying opportunity in the Market. 6.20.08
Enlarge the graph and listen to the interview.
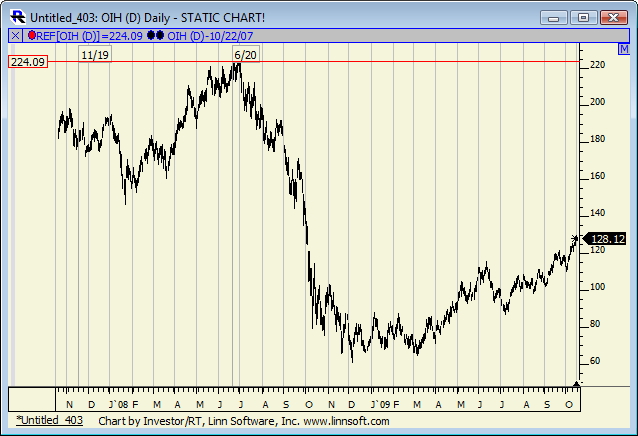
The Investment Rate and the risk of a Greater Depression
-
August 1, 2008 - MarketWatch
-
September 1, 2008 - MarketWatch
-
October 1, 2008 - MarketWatch
-
November 1, 2008 - MarketWatch
-
December 1, 2008 - MarketWatch
-
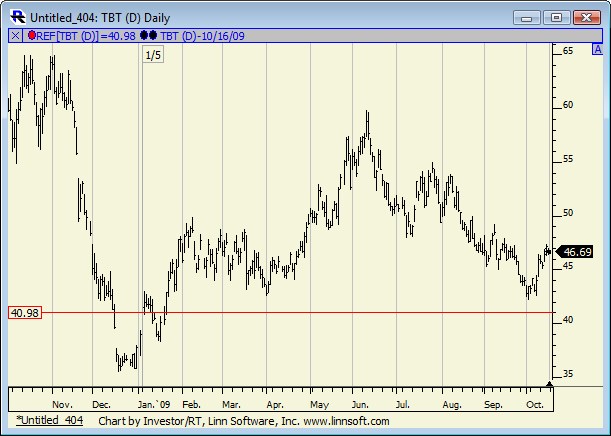
January 1, 2009 - MarketWatch
Buy TBT. Enlarge the graph and read the article:
-
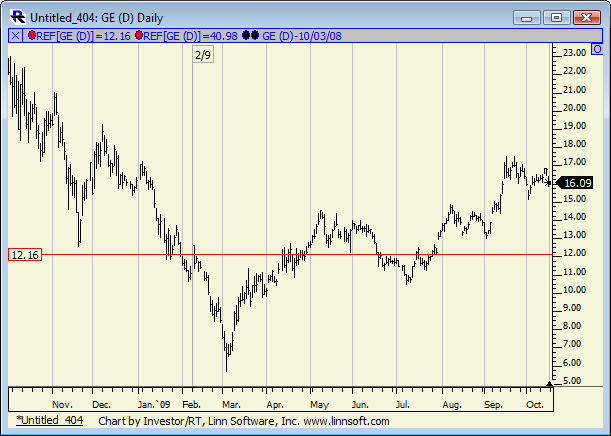
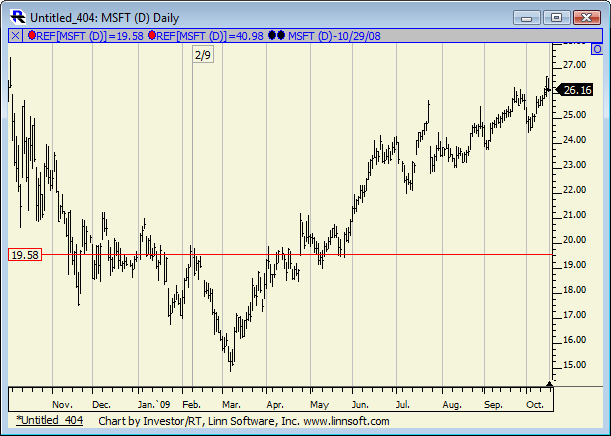
February 1, 2009 - MarketWatch
Buy MSFT and GE. Enlarge the graph, read the article, and listen to the interview.
-
March 1, 2009 - MarketWatch
-
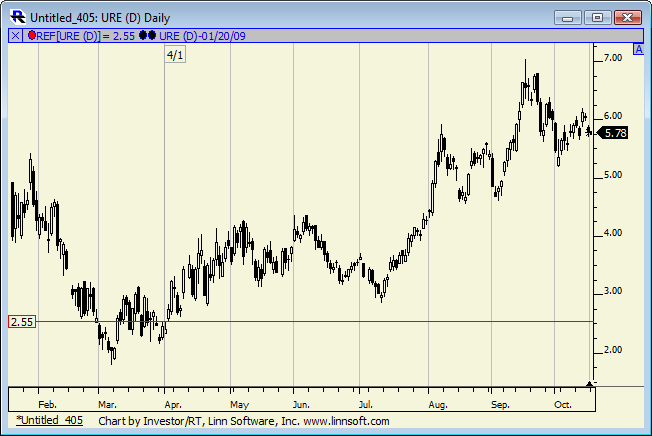
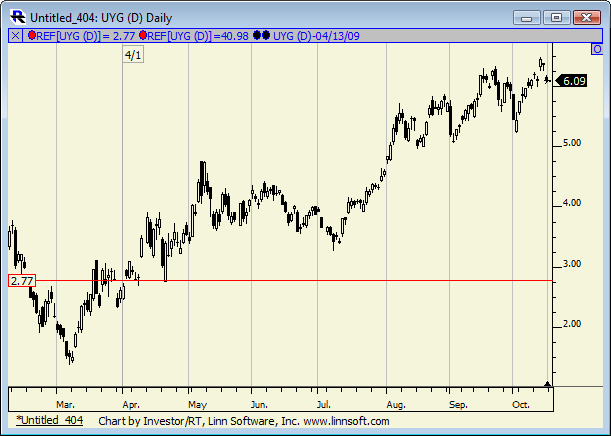
April 1, 2009 - MarketWatch
Buy URE and UYG. Enlarge the graphs and read the article:
-
May 1, 2009 - MarketWatch
-
June 1, 2009 - MarketWatch
MarketWatch did not run articles, but we provided daily updates to our clients as usual.
-
July 1, 2009 - MarketWatch
-
August 1, 2009 - MarketWatch
-
September 1, 2009 - MarketWatch
Read the article and listen to the interview.
-
October 1, 2009 - MarketWatch
-
12.29.09 - BNN - Thomas Kee discusses the long term impact of the Investment Rate
-
January 4, 2010 - MarketWatch
-
Feburary 1, 2010 - MarketWatch
-
March 1, 2010 - MarketWatch
-
March 15, 2010 - Barron's
-
April 1, 2010 - MarketWatch
-
May 3, 2010 - MarketWatch
-
May 12, 2010 - BNN - Buy and Hold is Dead
-
June 10, 2011 - BNN - Business Day: News of the Day
-
June 17, 2011 - BNN - Market Lookahead
-
January 24, 2012 - Fox Business interview about AAPL
-
CNBC Jeff Cox article, May 30, 2013
Price diverged from earnings growth at the time of this article, and we saw the first obvious influence of stimulus. The Market declined by an additional 5.4% after this, but then the influence of stimulus became obvious. It never looked back from there.
-
CNBC article Aug 25, 2013
This publicly reveals the concepts that are now our Global Liquidity Report series. Our Global Liquidity Report is a periodic Macroeconomic observation that was required by stimulus. Stimulus was a new form of asset demand, and it complements The Investment Rate. The combined model helps us define volatility and measure market risk a year in advance.
The case against FOMC Tapering:
Analysis the case against fed tapering this year -
Oct 30 2013 CNBC Article: Fed has enough ammo to Taper
-
Nov 2013 CNBC – Taper or not, here come higher rates
-
CNBC article Jan 3, 2014
This article suggests that investors use proactive risk-controlled strategies regardless of where the market goes, just in case. It is further evidence that we maintained our Proactive Mindset all through stimulus, while adding a couple features along the way.
-
Jan 22, 2014 CNBC Article: BlackBerry rocketed into 2014—time for a breather?
Blackberry stock rocketed into 2014 time for a breather commentary
-
2015
Our Sentiment Table was used by a money manager to achieve the 5th best performing strategy in the world per Hedgeco.
-
2015-2016
Corporate debt purchases were identified as a direct influence on equity markets. This was evident when the ECB took over stimulus from the ECB
-
2017
2017 was the most one-sided up market in our History.
-
2018-2019: CORE was developed to handle the liquidity drain after the post Credit Crisis stimulus phase.
The CORE Portfolio Strategy at Stock Traders Daily was developed in 2018 for 2019, to help buy and hold investors protect themselves when the post credit crisis stimulus era came to an end. The Fibonacci Calculator from Stock Traders Daily identified the best trading call in history, based on timing and magnitude. Minutes after the call the DJIA began to turn hgher from its lows of the day, and then it had a 1000 point reversal from there. It was the biggest 1-day reversal in history at that time. The assessment was that unless there was another call made at the exact same time as the Fibonacci call from Stock Traders Daily, then that was the best call in History. The move began minutes after the call, and the move was the biggest in the history of the market.
-
“Evitar Corte and the Corona Crash” book was written March 24, 2020.