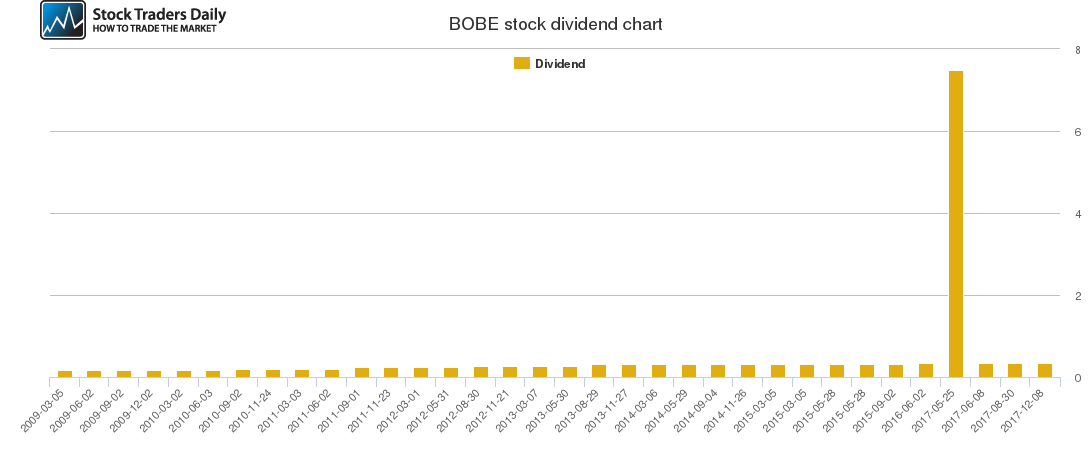
Bob Evans Farms (BOBE) Dividend Chart
Fundamental data and historical chart analysis — powered by Stock Traders Daily research.
← Scroll to view full chart →
Free Access to Our BOBE Reports
Start your 30-day trial and see how we use technical analysis to identify high-probability trade setups.
- Real-time pivot points & support/resistance levels
- Rules-based entry & exit plans for every stock
- Market crash early-warning (Evitar Corte model)
- We will show you how to see a Market Crash Coming
- As Seen On:


Backtesting BOBE
See how accurate our pivot points for BOBE are by applying simple T/A rules (buy near support – target resistance) to past published articles. We update data in real time for members; public articles are published every ~10 days.
$BOBE Technical Update
December 28, 2018
$BOBE Technical Update
December 15, 2018
$BOBE Technical Update
December 03, 2018
$BOBE Technical Update
November 20, 2018
$BOBE Technical Update
November 08, 2018
$BOBE Technical Update
October 26, 2018
$BOBE Technical Update
October 16, 2018
$BOBE Technical Update
October 05, 2018
$BOBE Technical Update
September 24, 2018
$BOBE Technical Update
September 13, 2018
$BOBE Technical Update
September 02, 2018
$BOBE Technical Update
August 22, 2018
The Dividend chart for Bob Evans Farms (BOBE) shows us the per share payout over time. Dividends are a distribution to shareholders, and they define how much money a company is roviding to its shareholders after all taxes and expenses have been paid. Before a company can pay shareholders a dividend, the company must pay taxes on the earnings, and then the shareholders must pay taxes too. Dividend income is therefore exposed to double taxation. Dividend income may be treated differently by various types of shareholders, and tax liabilities may change accordingly, but the company issuing a dividend will have had to either pay taxes on the earnings that generated the money to pay the dividend or would have had to acquire the cash in some non-taxable event. Normally, if a company pays a dividend to its shareholders, part of the EPS is shared with the shareholders, part of the EPS is deposited as cash reserves, and the rest is designated elsewhere. The cash reserves are important because if a company cannot pay a dividend because of an adverse temporary operating environment the company would draw from those reserves, pay the dividend from cash on hand, and keep its shareholders happy until normal operating conditions resume. Often, shareholders rely on dividends as a source of income, so a steady, reliable, and consistently growing dividend is often considered favorable by the investment community.
Here is how the Dividend Yield is calculated:
Dividend Yield = (dividend per share)/(price per share).Our Specialized Tools
Evitar Corte
Protection from Market Crashes: We help investors do this with our Evitar Corte Model. It identified every crash since 2000, in advance.

The Investment Rate (IR)
The IR is a measure of NATURAL LIQUIDITY. The IR identified the bookends of every long term stock market cycle since 1900.
Investment Approach
With a macro foundation (broad analysis), we offer actionable investment strategies that allow clients to make money in any market environment.