Growth Rate - Yearly CHART
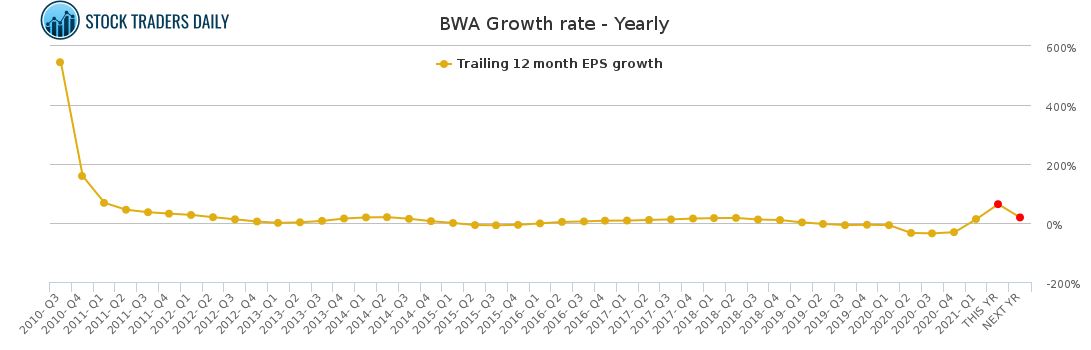
Borg Warner (BWA) — Growth Rate - Yearly
Fundamental data and historical chart analysis for Borg Warner — powered by Stock Traders Daily research.
BWA Growth Rate - Yearly Chart
Updated daily
What is a Yearly Growth Rate?
A yearly growth rate measures how much a company's earnings per share has changed compared to the same period one year ago. It is expressed as a percentage and gives investors a clear view of whether a company is growing, shrinking, or staying flat on an annual basis.
Why Does It Matter?
Annual growth rates smooth out the seasonal fluctuations that can distort quarterly numbers. Because many businesses have strong and weak seasons, the yearly comparison gives a more reliable picture of the underlying growth trend of the business over time.
How to Read the Chart
A rising yearly growth rate indicates that earnings are accelerating — the company is growing faster than it was before. A declining growth rate, even if still positive, signals that growth is slowing. When the line crosses below zero, the company is earning less per share than it did a year ago, which can be a warning sign.
What Causes Changes in Yearly Growth Rate?
Growth rates can be influenced by revenue increases, cost cutting, share buybacks, or one-time events. Investors typically look for companies with consistent, sustainable growth rates rather than those driven by temporary factors.
Past Coverage
News & Analysis — BWA
July 27, 2026
Technical Reactions to BWA Trends in Macro Strategies
Read article →
July 16, 2026
Trading the Move, Not the Narrative: (BWA) Edition
Read article →
July 04, 2026
Trading the Move, Not the Narrative: (BWA) Edition
Read article →
June 23, 2026
(BWA) Volatility Zones as Tactical Triggers
Read article →
June 12, 2026
Price-Driven Insight from (BWA) for Rule-Based Strategy
Read article →
June 01, 2026
(BWA) Price Dynamics and Execution-Aware Positioning
Read article →
May 21, 2026
(BWA) as a Liquidity Pulse for Institutional Tactics
Read article →
May 10, 2026
(BWA) Risk Channels and Responsive Allocation
Read article →
April 29, 2026
(BWA) Movement as an Input in Quant Signal Sets
Read article →
April 18, 2026
Liquidity Mapping Around (BWA) Price Events
Read article →
April 07, 2026
Why (BWA) Price Action Is Critical for Tactical Trading
Read article →
March 27, 2026
Understanding Momentum Shifts in (BWA)
Read article →
March 16, 2026
Avoiding Lag: Real-Time Signals in (BWA) Movement
Read article →
March 05, 2026
Discipline and Rules-Based Execution in BWA Response
Read article →
February 22, 2026
Behavioral Patterns of BWA and Institutional Flows
Read article →
Our Specialized Tools
Institutional-Grade Research
Risk Control
Evitar Corte
Protection from market crashes. We help investors identify every crash since 2000, in advance, using our proprietary model.
Learn more →
Macro Indicator
The Investment Rate (IR)
A measure of natural liquidity. The IR identified the bookends of every long-term stock market cycle since 1900.
Learn more →
Strategy
Investment Approach
With a macro foundation, we offer actionable investment strategies that allow clients to make money in any market environment.
Learn more →