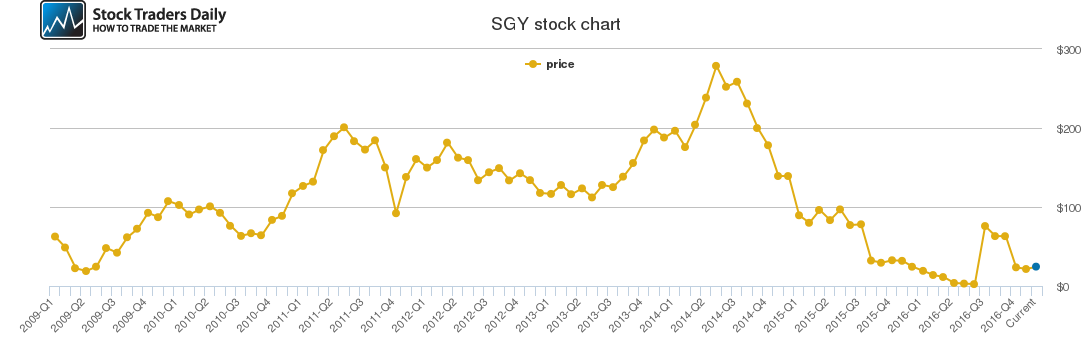
Stone Energy (SGY) Stock Chart
Fundamental data and historical chart analysis — powered by Stock Traders Daily research.
← Scroll to view full chart →
Free Access to Our SGY Reports
Start your 30-day trial and see how we use technical analysis to identify high-probability trade setups.
- Real-time pivot points & support/resistance levels
- Rules-based entry & exit plans for every stock
- Market crash early-warning (Evitar Corte model)
- We will show you how to see a Market Crash Coming
- As Seen On:


Backtesting SGY
See how accurate our pivot points for SGY are by applying simple T/A rules (buy near support – target resistance) to past published articles. We update data in real time for members; public articles are published every ~10 days.
$SGY Technical Update
January 04, 2019
$SGY Technical Update
December 22, 2018
$SGY Technical Update
December 10, 2018
$SGY Technical Update
November 27, 2018
$SGY Technical Update
November 15, 2018
$SGY Technical Update
November 02, 2018
$SGY Technical Update
October 23, 2018
$SGY Technical Update
October 12, 2018
$SGY Technical Update
October 01, 2018
$SGY Technical Update
September 20, 2018
$SGY Technical Update
September 09, 2018
$SGY Technical Update
August 30, 2018
$SGY Technical Update
August 18, 2018
Why is a Stock's Price so important?
Price action tells us where smart money investors are buying and selling a particular stock, or the stock market. This is the most efficient tool to facilitate active rules based trading strategies. Price matters most, more than our interpretation of news and events too, because it is always right. Even when price action appears wrong it is right, because we are dependent on price action to make money, and we should use price based observations to determine when to make important decisions.Technical Analysis and Stock Price:
The Stock Price Chart contained here is smoothed, and does not include any of the technical indicators that we offer our subscribers. Price action tells us where to buy and sell, and this information is part of our subscription service only.Our Specialized Tools

Evitar Corte
Protection from Market Crashes: We help investors do this with our Evitar Corte Model. It identified every crash since 2000, in advance.

The Investment Rate (IR)
The IR is a measure of NATURAL LIQUIDITY. The IR identified the bookends of every long term stock market cycle since 1900.

Investment Approach
With a macro foundation (broad analysis), we offer actionable investment strategies that allow clients to make money in any market environment.