Susquehanna Bancshares (SUSQ) P/E Chart
Fundamental data and historical chart analysis — powered by Stock Traders Daily research.
← Scroll to view full chart →
Free Access to Our SUSQ Reports
Start your 30-day trial and see how we use technical analysis to identify high-probability trade setups.
- Real-time pivot points & support/resistance levels
- Rules-based entry & exit plans for every stock
- Market crash early-warning (Evitar Corte model)
- We will show you how to see a Market Crash Coming
- As Seen On:


Backtesting SUSQ
See how accurate our pivot points for SUSQ are by applying simple T/A rules (buy near support – target resistance) to past published articles. We update data in real time for members; public articles are published every ~10 days.
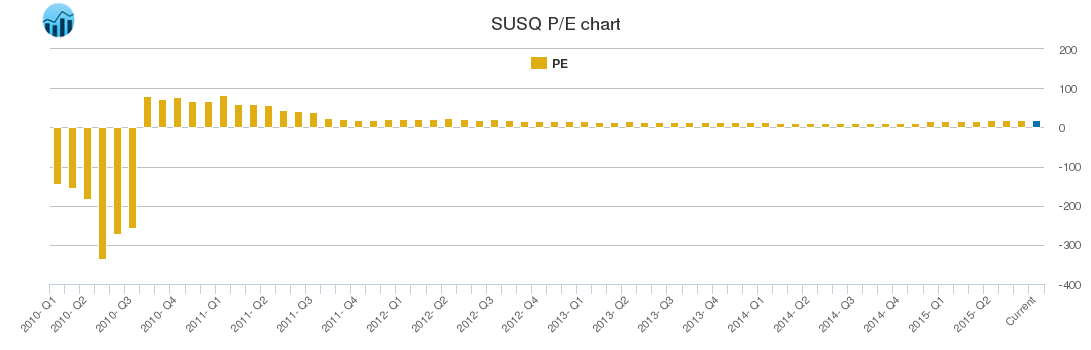
What is a PE Ratio?
The PE Ratio chart for Susquehanna Bancshares (SUSQ) is a valuation observation. A PE Ratio is a price to earnings ratio that has historically helped investors define fair value. This is often referred to as the multiple of a stock, and when groups, markets, or sectors are defined the multiples of all the stocks in those groups can be averaged to define average PE multiples as well. Average PE multiples have been popularized in recent years because historical comparisons make current valuations look stretched. Instead of comparing historical averages, investors today use peer groups to compare PE multiples for individual companies because those stocks often trade in the higher PE spectrum that exists in today's environment. However, the fact remains that a PE ratio reveals how much an investor is willing to pay for the earnings of a company at any given time. The higher the PE multiple the more expensive a company may be, but that is not always true. The PE ratio simply reveals how many times earnings an investor is willing to pay, or that a shareholder is willing to maintain. The PE Ratio alone does not reveal fair value. Fair value is what someone is willing to pay, they say, and that is true, but in a time of free money and stimulus the willingness to pay more may also be skewed. Multiples can increase based on fabricated demand even if earnings growth does not warrant the higher valuation levels. PE ratios still provide comps to peer groups, but they do not represent free market fair value anymore.How is the Price to Earnings (PE) Ratio Calculated?
The PE Ratio = (Per Share Stock Price/EPS)Our Specialized Tools

Evitar Corte
Protection from Market Crashes: We help investors do this with our Evitar Corte Model. It identified every crash since 2000, in advance.

The Investment Rate (IR)
The IR is a measure of NATURAL LIQUIDITY. The IR identified the bookends of every long term stock market cycle since 1900.

Investment Approach
With a macro foundation (broad analysis), we offer actionable investment strategies that allow clients to make money in any market environment.